
Socio-Demographic Sub-Indicator
The socio-demographic sub-indicator provides an overview of the population and certain income characteristics of the state sub-group. The socio-demographic indicator is relevant to determining the status of sustainability in a state because it can be used to predict trends in workforce and government service requirements. This indicator lays a baseline for the services the population provides themselves and what they may provide in the future. This indicator will be used as part of the comprehensive economic sustainability index.
Metrics
- Population Growth Rate
- Median Age of Population
- Proportion of Population under the Age of 18
- Proportion of Population Aged 65 or Older
- Labor Force Participation Rates
- Median Household Income
All data were collected using the American Community Survey as administered by the Census Bureau (United States Census Bureau B 2014). Data for the American Community Survey is collected annually. For county-level data, five-year averages were used for data representative of 2008-2013. Data collected earlier than 2008, but before 2006 is a three-year average. Data collected in 2006 and prior is a one-year average. State level data are one-year estimations. Data with dollar amount unit of analyses have been converted to 2013 dollars using generally accepted deflators from Oregon State University (Oregon State University 2014). The dollar amounts were multiplied by the deflators as provided from Oregon State University to determine the 2013 dollar amount.
Findings in this sub-indicator
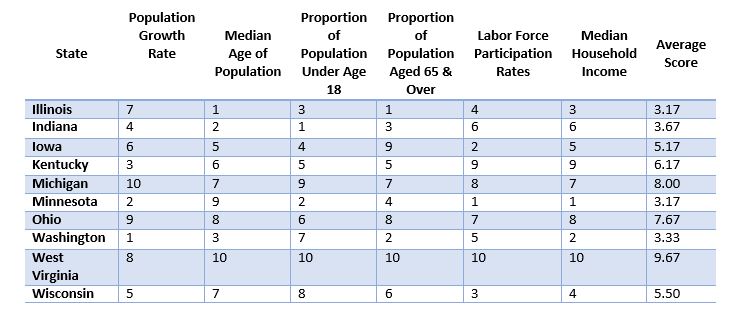
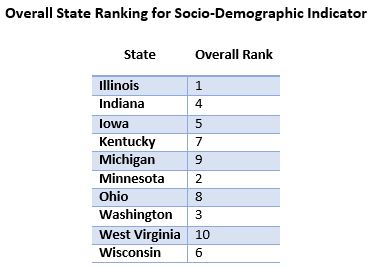
Overall, the information presented in this analysis will be related to how governments collect revenue and how grants and other aid will be distributed (ICMA 2003). An aging population will require services that differ from a young population. Service distribution, such as tuition assistance, parks and recreation, and medical services, is an important factor of how governments operate. Labor force participation and median income both explain which citizens and to what extent they contribute to the economy. Indiana consistently ranks in the middle of the other nine states up for analysis. West Virginia consistently ranks on the low end of these metrics. Indiana must consider their socio-demographic position as that will ultimately shape overall environmental, equity, and economic sustainability.
![]()