
Government Financial Sustainability Sub-Indicator
Evaluating a government’s financial sustainability is vital to a variety of groups that directly and indirectly interact with a government. Governments are the primary provider of services and infrastructure, which play a vital role in the continued growth of an entity’s economy. Governments that fail to provide an adequate amount of services and sufficient infrastructure can burden an economy and slow their growth potential. The financial sustainability of a government entity determines whether it can provide the necessary services and infrastructure that can support sustained economic development and improved quality of life.
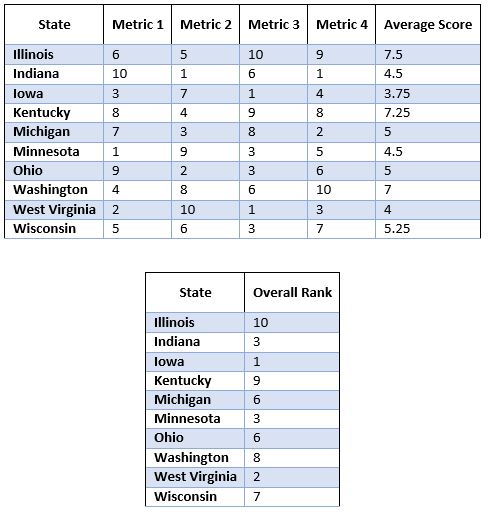
The government financial sustainability sub-indicator uses four metrics to evaluate the fiscal condition of states: expenditures per capita, revenues per capita, operating deficit or surplus, and long-term debt per capita. These four metrics provide a snapshot of the past, current, and future ability of a state government to provide services and infrastructure to its citizens and support its economy. Data for this sub-indicator was compiled from the Comprehensive Annual Financial Report for each state from FY2005-2013. Population data used in converting expenditures, revenues, and long-term debt into per capita was gathered through US Census Bureau and the American Community Survey’s one-year estimates of total state population. Data in dollar amounts were converted into constant 2013 US dollars using inflation conversion factors provided by Oregon State University. Results from each metric are presented in the graphs below.
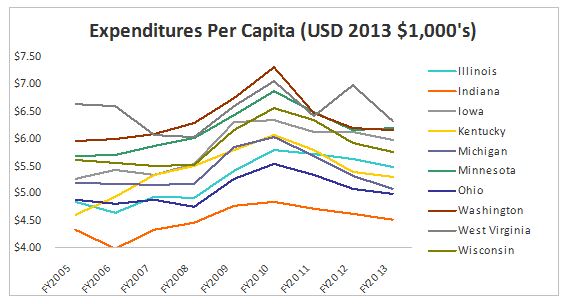
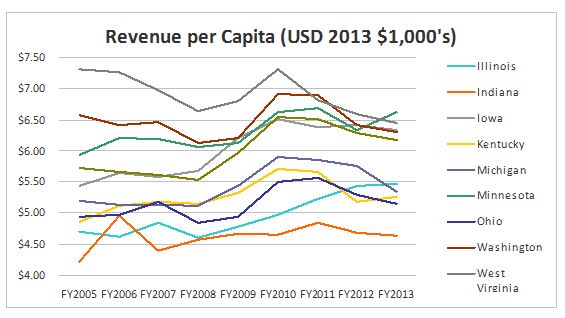
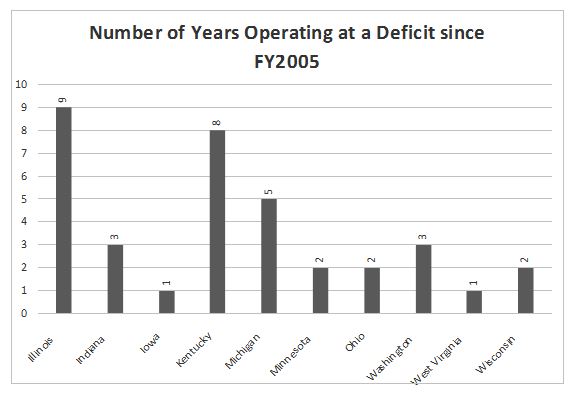
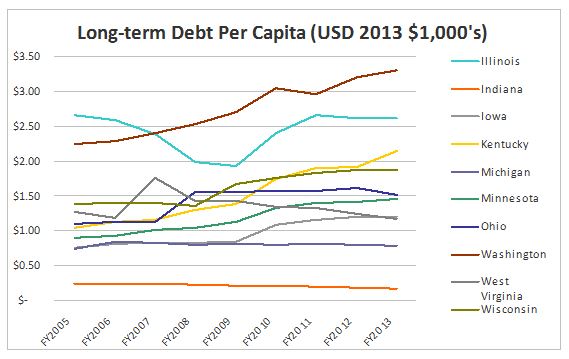
As states have moved out of the Great Recession and into the current period of economic growth, governments will need to find new sources of revenue as federal grants and other sources are scaled back in order to maintain current expenditure levels. The 2010 stimulus package is relevant to our analysis as we see a large peak in revenues and expenditures per capita for FY2010. This is primarily due to large sums of federal grants being transferred to the states without significant increases in population within these states to counterbalance the metric. It is important to note that long-term debt per capita does not experience this peak in FY2010 as the majority of the federal funds were used to pay for capital projects that did not require long-term debt financing. Using these funds for long-term liabilities would be poor financial management as the states could never expect the federal government to maintain those grant levels. However, the federal government did enact a Build America Bonds program which gave subsidies to state and local governments to lower borrowing costs when accessing the capital markets. This could be an explanation for the slight increase in about half of the states’ long-term debt per capita levels after FY2010. Several states resorted to drawing down reserve fund levels during the Great Recession by operating at a deficit during this time. While these reserve funds are in place for this purpose, Illinois and Kentucky have continually operated at a deficit both before and after the recession which could lead to long-term financial issues.
Indiana ranks third in the overall state ranking for government financial sustainability. This can be attributed to Indiana’s sound financial practices and fiscally conservative politics over the last two decades. While it appears that Indiana does enjoy strong financial sustainability, concerns can be made that Indiana is not providing enough services and infrastructure to the state in order to harness the true potential of the state’s economy. Overall, Indiana maintains solid financial sustainability but could look to expand more services and infrastructure projects to facilitate sustained economic development and improved quality of life for the state.
![]()