
Overview of Index
When tasked with building an expansive project to review and rate the complex interactions between ecosystems and various sectors within US states, the design, and framework of the index are paramount to ensuring robust and meaningful results. In deliberation with our group, advisors, and client, the SustainIN team decided to approach this sustainability index through the lens of various sectors. Those sectors were determined to be: Agriculture, Energy, Forestry, Industry, Mining, and Residential. Within each sector, it was determined that the sector’s impact on the environmental media of air, water, land, and biota would be assessed.
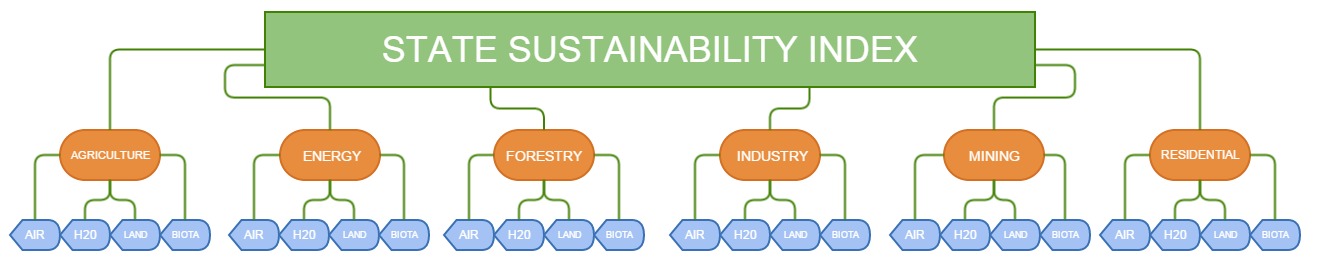
Additionally, it was decided that each metric would include a policy component and general review of its impact where feasible. This sector-based, top-down approach allowed our group to focus on each sector’s environmental sustainability impact and identify existing problem areas within each state. The sector-based approach also allowed our group to provide more targeted and impactful policy solutions and considerations for each sector. It is our hope that this framework and the summation of this project will enable and motivate states to work towards a greater level of sustainability.
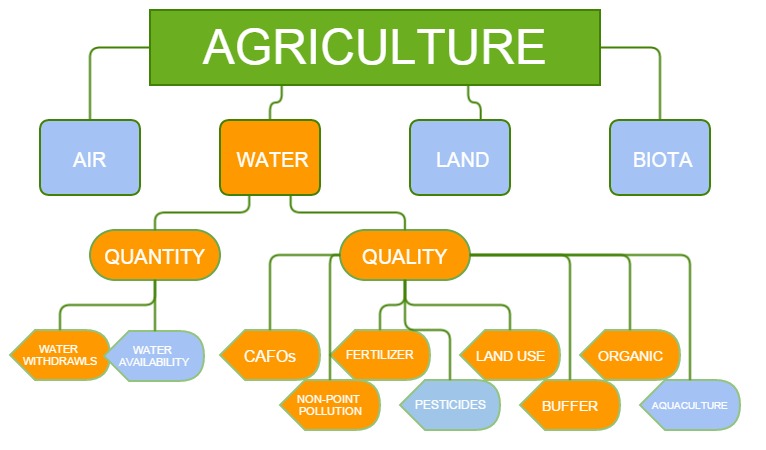 The Fall 2014 semester’s focus is on the agriculture sector’s impact on water quality and sustainability. The above figure details the design of the Agriculture Index and this report’s focus on water metrics. It was determined that both quality and quantity component were necessary for each of the water metrics within the index. For water quantity, it was determined that metrics relating to water availability and water withdrawals be included. However, our group was unable to include a metric for water availability in agriculture this semester and suggest that this metric be completed in the next State Sustainability Index capstone.
For water quality within agriculture, we chose the following metrics due to their role in water pollution: Concentrated Animal Feeding Operations, Non-Point Source Pollution, Fertilizers, Pesticides, Land Use, Water Buffers, Organic Agriculture, and Aquaculture. Of these metrics, pesticides, and aquaculture were briefly reviewed in the report, but it is suggested that future capstone classes work to expand these metrics for inclusion in the final index.
While we have chosen to frame the State Sustainability Index in the context of industry and further with the sub-context of environmental media, we realize that this framing is not immune to scrutiny and that every model has inherent weaknesses. One concern within our framework is our defining of the various sectors and their complex interactions among each other. For example, the energy sector very clearly affects each other sector within our framework. To separate out these effects would be difficult, if not impossible, and highlights how important developing a robust sustainability index is for each state. We believe, however, that the analysis and framework we have developed best captures the available information and allows policy leaders, citizens, and activists to target sustainability issues with each sector better and within each state.
To view the index results, Click Here.
![]()
© 2016 Hoosier Environmental Council