
Economic Performance Sub-Indicator
Economic Performance is an important indicator of the economic health, condition, and sustainability of states and counties. Economic performance can be assessed using a host of well-known and readily available metrics. Government sources provide readily available data for many metrics that combine to form a holistic view of a state or county’s economic performance. Many of these same metrics are the most favored by credit rating firms in determining the credit worthiness of U.S. states (O’hara 2012). In this section, six metrics are employed to inform rankings and snapshots of economic performance in the ten focus states of this study. We also examine Indiana counties using several of these metrics. In most cases, the United States average is included to enable comparison between Indiana, the nine other focus states, and the national average.
Metrics with Data Sources
- Gross Domestic Product, Per Capita (Bureau of Economic Analysis Regional Data)
- Poverty Rate (American Community Survey and Current Population Survey)
- Per Capita Income (Bureau of Economic Analysis Regional Data)
- Industry Mix – Location Quotients (Bureau of Labor Statistics, Quarterly Census of Employment and Wages)
- Construction Activity – New Privately Owned Residential Construction Valuation Per Capita (Census Bureau, Building Permits Survey)
Methodology and sources
We converted all dollar figures to 2013 dollars using inflation conversion factors made available by Robert Sahr of Oregon State University (Sahr 2015). Sahr’s conversion factors rely upon the Bureau of Labor Statistics’ Consumer Price Index (CPI) figures.
Converting to real dollar amounts accounts for the effects of inflation and provides a more illustrative comparison of changes within units of analysis over time. We normalized total state GDP Figures by converting them to per capita figures, using American Community Survey (ACS) population estimates for each year 2005-2013, and Current Population Survey for years 2000-2004 (United States Census Bureau 2014d; 2014e; 2014f).
For the industry mix metric, after collecting all data we narrowed the results to focus on only those SuperSectors, Sectors, and Sub-Sectors that appear most relevant to the agricultural and energy focuses of this report to date. The final report presents location quotients for 2013 and does not include a time series analysis of employment mix.
United States total or average figures are included in the final report to enable comparison between our subset of states and the nation as a whole. States are ranked for each metric according to the average figure or dollar amount over the time span studied.
RESULTS:
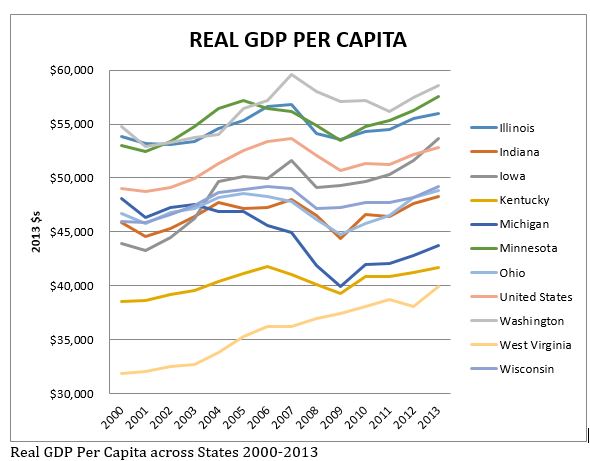
Gross Domestic Product Per Capita
Most of the focus states experienced a slight upward trend in GDP per capita from 2000 to 2013. Most states peaked around 2007 and experienced relatively sharp declines in 2008 or 2009. These uniform declines correspond with the economic recession occurring between December, 2007 and June, 2009 (National Bureau of Economic Research 2010).
Poverty Rate
Indiana ranked sixth of the ten focus states for poverty rate in 2013. While Indiana’s poverty rate is very close to the national rate, it is almost five percentage points above Minnesota’s rate—the lowest amongst the ten focus states. The Indiana rate is also growing slightly faster than the national rate since 2000.
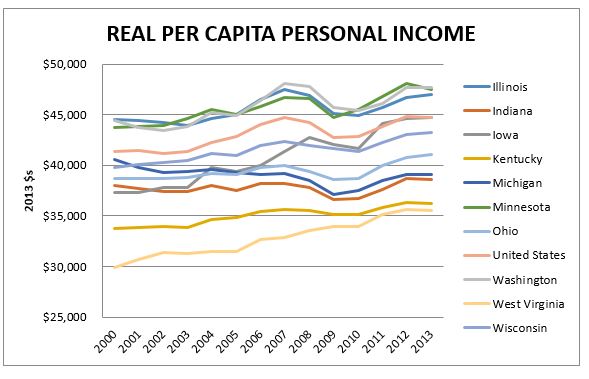
Per Capita Income
Nationwide, real per capita personal income followed a slightly increasing trend from 2000-2013. Figure 6 below illustrates this trend. The data reveal a wide gap, with more than $10,000 separating Washington and West Virginia, the highest and lowest states, respectively.
Indiana and Michigan are two states that noticeably deviate from the general, yet slight, upward trend of other states. All focus states besides Michigan experienced increased real per capita personal incomes. The average change from 2000-2013 was $2,978. Indiana’s real per capita personal income increased by the smallest amount, at just $579.
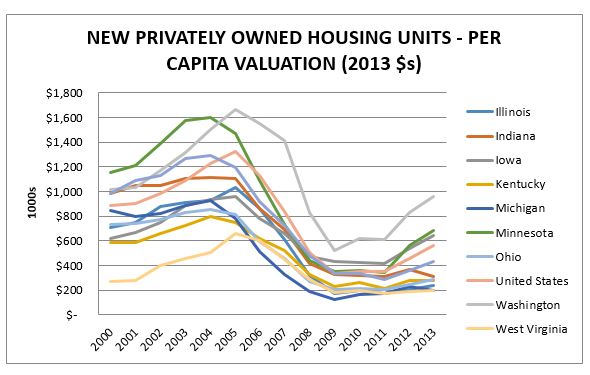
Construction Activity – New Privately-Owned Residential Construction Valuation Per Capita
Building Permit Survey data reveal a noticeable and common trend amongst the ten focus states. National data follow the same trend. The so called “bursting” of the housing bubble that occurred around 2004 is marked by a sharp decline in the per capita valuation of new privately owned housing units of most of the focus states. All states experienced some decline following 2004 or 2005, and some much more sharp of a decline than others.
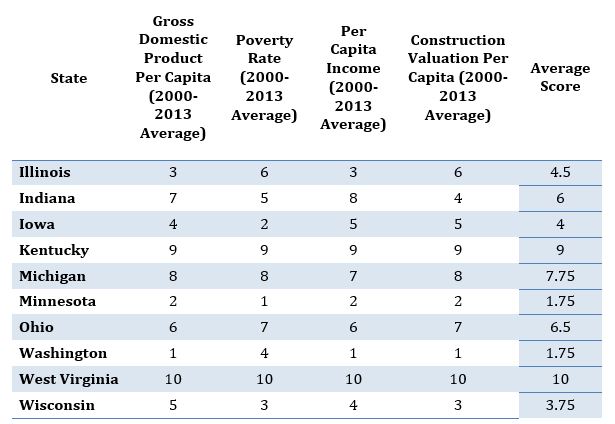
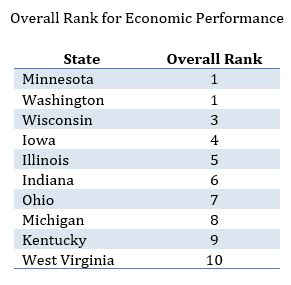
Overall Results
Summary of State Rankings for Economic Performance Metrics
![]()