
Poverty Sub-Indicator
Poverty alleviation is one of the great targets in sustainable development and achieving social equality. As a sub-indicator, poverty has strong links with other metrics related to growth, socio-economics, health, and even the environment (Hopwood, Mellor and O’Brien 2005) and is listed in multiple studies on sustainability indices (Anielski 2001; Hodge 1997; Lee and Huang 2007; New Jersey Future 1999; Schlossberg and Zimmerman 2003). The poverty sub-indicator measures the percentage of individuals, households and children in each state that are suffering from poverty.
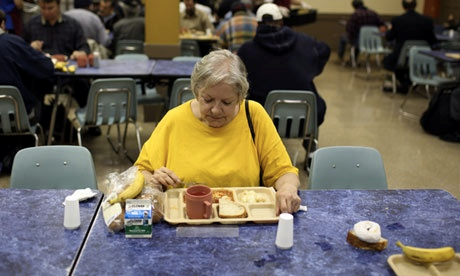
The poverty-related metrics in the Economy indicator focus on the impact of poverty on economic growth and the financial well-being of the states. The poverty sub-indicator in Social Equity, on the other hand, emphasizes the inequality resulting from individuals’ lack of financial resources. In addition, this sub-indicator addresses the kinds of basic needs that may not be adequately available for a poor population, including access to food and shelter.
Metrics and Data Sources:
| Metric Name | Definition | Data Source |
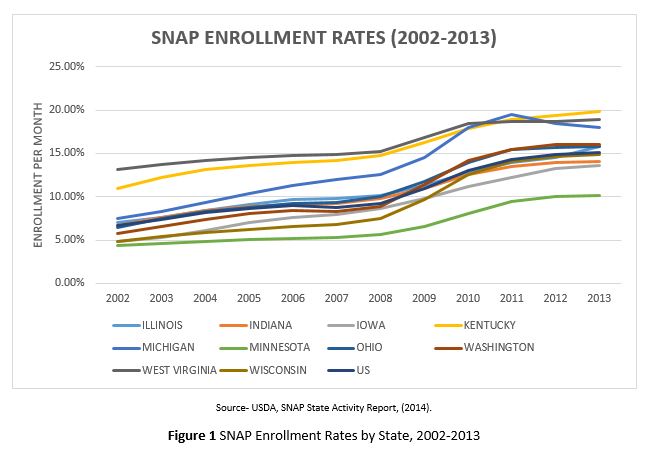
| The Supplemental Nutrition Assistance Program (SNAP) enrollment rates | The number of persons participating in the program monthly divided by the estimated population | The annual SNAP State Activity reports published by United States Department of Agriculture (USDA) from 2002-2013 (USDA 2003-2014) |
| Child Poverty | The percentage of children who are living in families with incomes below the federal poverty line. Children are defined as individuals under the age of 18 | The American Community Survey (ACS) from year 2000 to 2013 (U.S. Census Bureau, 2015) |
| Families in Poverty | The percentage of households with incomes below the federal poverty level | The American Community Survey (ACS) from year 2000 to 2013 (U.S. Census Bureau, 2015) |
| Homelessness Rates | The number of unsheltered persons divided by the estimated population | National Alliance to End Homelessness’ (2014) report on the U.S.’s homelessness situation in 2012 and 2014 |
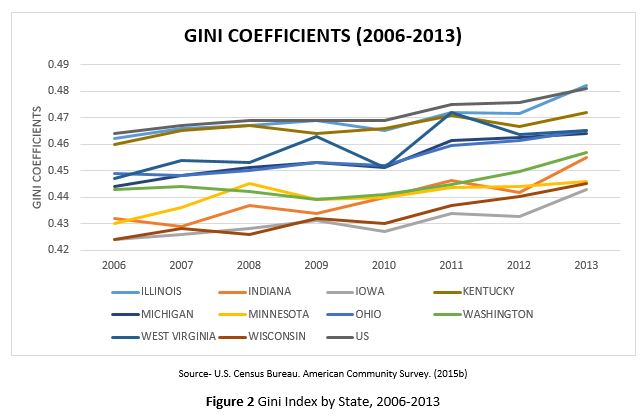
| Income and Wealth Inequality | Gini coefficient | The American Community Survey (ACS) from year 2006 to 2013 (U.S. Census Bureau, 2015) |
Preview of Results:
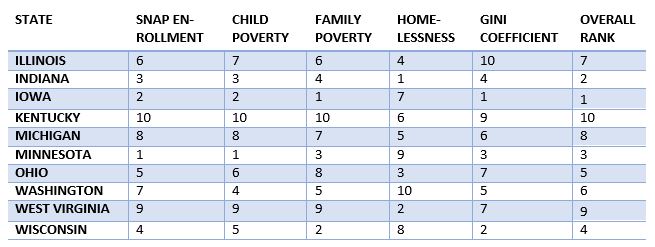
 Metric Findings:
- SNAP enrollment rates have increased more than twofold from 2002 to 2013
- Indiana’s child and family poverty rates have been decreasing drastically since 2011
- Indiana had the lowest share of individuals who were homeless in 2013
- Overall, the ten states are more equal than the U.S. average in terms of income and wealth. The most “unequal” state has been Illinois
- The income and wealth disparity in the U.S. has been increasing, especially after the Great Recession
Policy Considerations:
- Increase the percentage of the low-income population enrolled in the SNAP program. A higher percentage of the low-income population in the SNAP program would transfer into more rapid or more efficient anti-poverty progress, due to the strong anti-poverty effect of the program.
- Further study the geological correlation between high child and family poverty rates and pollutants or hazardous materials in the environment. The child and family poverty rates may be linked with environmental inequality concerns, because poor families often are left with no choice but living in toxic housing conditions or polluted neighborhoods.
- Increase the provision of affordable housing or reduce the housing cost burden, in addition to reducing the overall poverty rates.
![]()