
Health and Safety Sub-Indicator

Health and safety both address individuals’ and families’ need to live in a protected environment, and both are determined by people’s living environment, financial conditions and access to different resources. The sustainability index literature usually includes human health indicators such as illness rates, health care coverage, and life expectancy (Anielski 2001; Hodge 1997). This report incorporates public safety metrics because these equally relate to a person’s well-being. Similar to health problems, safety issues connect closely to other socioeconomic concerns, including public service provision, neighborhood deterioration, child growth, land use, and housing prices. The Oregon sustainability benchmarks study, as well as the Taipei sustainability index study, also contain indicators such as crime rates, number of transportation accidents, child abuse or neglect, and recidivism, in addition to multiple indicators on health (Lee and Huang 2007; Schlossberg and Zimmerman 2003).
Metrics and Data Sources:
| Metric Name | Definition | Data Source |
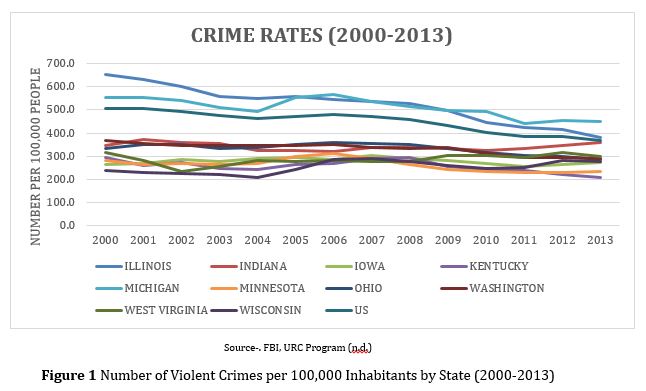
| Crime Rates | The number of violent crimes per 100,000 inhabitants within each state | The Federal Bureau of Investigation’s (FBI) Uniform Crime Reporting (UCR) Program through 2000 to 2013 (FBI n.d.) |
| Health Insurance Coverage | The percentage of people without any type of health insurance coverage, whether it is a private insurance plan or a federal insurance program | U.S. Census Bureau’s Small Area Health Insurance (SAHIE) Program from 2008 to 2013 (U.S. Census Bureau n.d.) |
| Adult Obesity | The percentage of population with a BMI exceeding 30 | Centers for Disease Control and Prevention’s (CDC) Behavioral Risk Factor Surveillance System (BRFSS), covering year 2000 to 2013 (CDC,2015) |
| Infant Mortality | The number of infant deaths per thousand live births | The National Vital Statistics Reports from the 2010 period (Matthews, et al. 2013) |
| Teen Births | The number of births per one thousand females ages 15 to 19 | CDC’s birth data in the National Vital Statistics System (CDC 2015) |
| Disability Prevalence | The percentage of working-age population who finds difficulty in the following categories of activities: hearing, visual activities, cognitive activities, ambulatory activities, self-care, or independent living | The 2012 Annual Disability Status Report of United States (Erickson, Lee and von Schrader 2014) |
| Life Expectancy | The average number of years remaining at birth | Measure of America (2015) using 2013-2014 data set |
| Asthma Prevalence | Adult lifetime asthma prevalence rates (percent) by state | CDC’s BRFSS (2015) from 2000 to 2013 |
| Lung Cancer | The number of lung cancer incidences per 100,000 people | U.S. Cancer Statistics report (U.S. Cancer Statistics Working Group 2014), data on year 2011 |
| Chronic Lower Respiratory Deaths | The age-adjusted rates of chronic lower respiratory death per 100,000 people | The National Vital Statistics Report (CDC forthcoming) on year 2013 |
| Cardiovascular Deaths | The age-adjusted rates of cardiovascular death per 100,000 people | The National Vital Statistics Report (CDC forthcoming) on year 2013 |
Metric Findings:
- The crime rates have been on a gradual decline over the past ten years
- Three counties in Indiana have had greater than 20 percent of their population uncovered by any kinds of health insurance since 2009 (Daviess County, Elkhart County and Lagrange County)
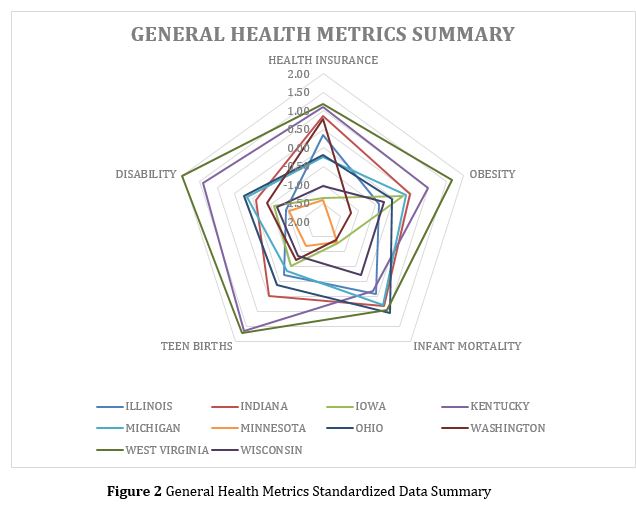
- The adult obesity rates in all ten states have exceeded 20 percent since 2002
- Close to one-third of Indiana’s population were obese in 2013
- The infant mortality rates in the U.S. have been low and continue to decline
- Teen birth rates have also been on the decline over the past five years
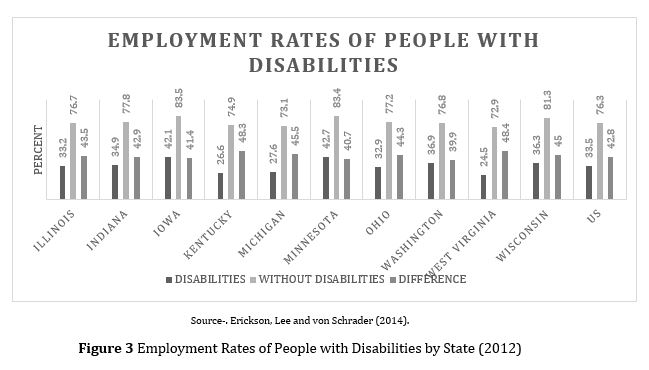
- West Virginia and Kentucky had the largest disparity in employment rates among people with and without disabilities (over 48 percentage points) in 2012, whereas the difference in Washington was lower than 40 percentage points
- Indiana residents’ life expectancy is over one year less than the U.S. average based on 2013-2014 data
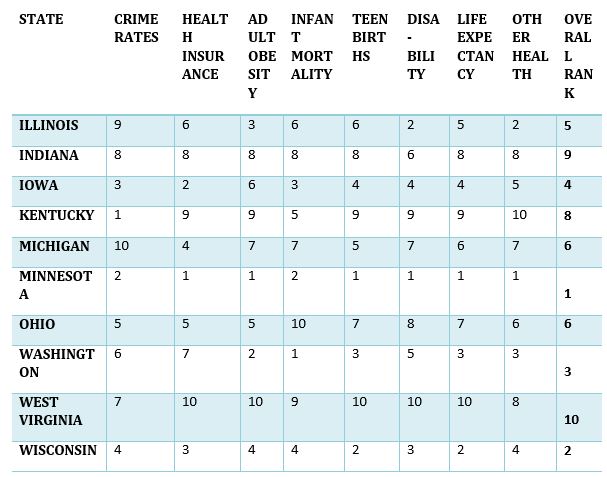
- Minnesota performs the best in overall health while West Virginia performs the worst
Policy Considerations:
- Indiana performs relatively well on disability prevalence but had high rates of people uncovered by any health insurance, high obesity prevalence, high teen birth, and infant mortality rates. The well-being of Indiana’s population is at higher risks as compared with other Midwestern states.
- Improve health insurance coverage. High rates of population without health insurance coverage and high obesity prevalence could result in worse health outcomes. For instance, people with health insurance are more likely to visit a doctor and receive health care services (Hall and Diehm 2013).
- Focus on the health care, especially prenatal care services due to the high infant mortality rates, and environmental regulations. Indiana ranked low on life expectancy and the metrics related to air pollution, indicating potential environmental problems that may negatively impact on local people’s health.
- Further study on the population’s average access to Social Security Disability Insurance and Supplemental Security Income benefits, which measure the available resources to the population with disabilities as well the state’s performance on narrowing the disparity between the populations with and without disabilities.
![]()