
Education Sub-Indicator
 Education is one of the primary means of social mobility, and ensuring that all children and young-adults have access to a quality education is imperative to sustainability. Education indicators likely have a direct impact upon economic indicators and other equity metrics. Economic indicators also influence education-related metrics because public school systems are funded through state and local tax revenue sources. The following metrics capture information about the state of education and its accessibility. These metrics are based on metrics used in prominent social equity indices from Australia, the United Nations, Sustainable Seattle, the Partnership for Sustainable Communities, and the President’s Council on Sustainable Development.
Metrics and Data Sources:
| Metric Name | Definition | Data Source |
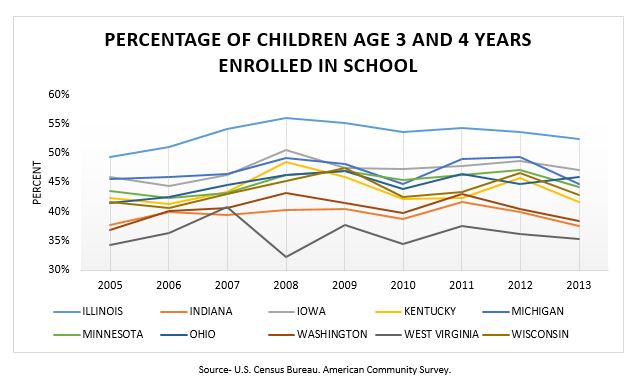
| Pre-School Program Enrollment | The percentage of children age 3 and age 4 that are enrolled in a public or private pre-school program | U.S. Census Bureau American Community Survey 1-year estimates (2005-2013) |
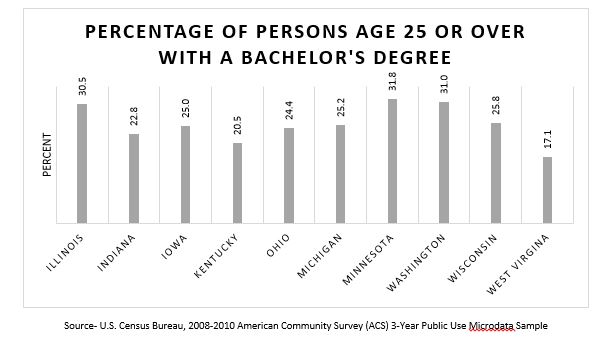
| Educational Attainment | The percentage of the population age 25 and older that holds a Bachelor’s degree | U.S. Census Bureau American Community Survey Microdata Sample (2008-2010) |
| Adult Literacy | The percentage of the adult population lacking basic prose skills | National Center for Education Statistics’ National Assessment for Adult Literacy (1992, 2003) |
| Linguistic Isolation | The percentage of households that experience linguistic isolation, a household in which no person 14 years old and over speaks only English, and no person 14 years old and over who speaks a language other than English speaks English “very well” | U.S. Census Bureau American Community Survey 1-year estimates (2005-2009) |
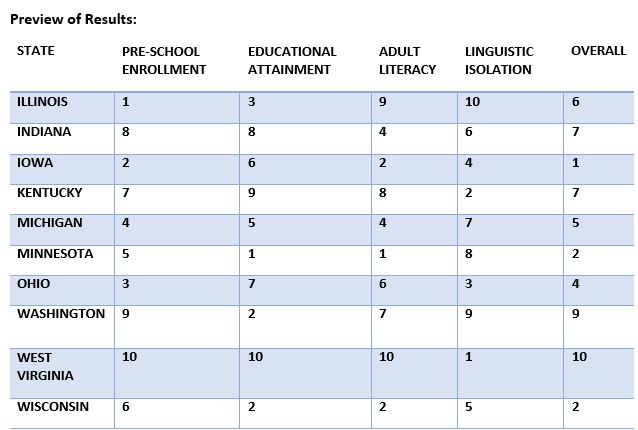
Metric Findings:
- Indiana’s pre-school program enrollment rate has remained flat during the previous decade, hovering around 40 percent which is around 10 percent lower than the national average.
- Only 22.8 percent of persons in Indiana hold at least a Bachelor’s Degree, making it the third worst ranking state for this metric among those analyzed.
- Eight percent of Indiana’s adult population has low literacy skills.
- Levels of linguistic isolation are low (2 percent or lower) for all of the states except Illinois and Washington.
Policy Considerations:
- Low scores in the Education metrics may indicate inadequate access to education and programs that defray the cost of pre-school and post-secondary education. States should consider the implications that would arise if certain groups are effectively priced out of postsecondary education.
- Lack of access to literacy programs and English-language programs may lead to isolation of certain ethnic or low-income communities. States should allocate or continue to allocate funds to these programs.
![]()