
Livability Sub-Indicator
 The following metrics attempt to capture information about the fairness, distribution, and accessibility of resources essential to a high quality of life. These resources include affordable, quality housing and transportation options. A livable community is one that allows individuals to meet their basic needs, while creating a sense of community and belonging through participatory planning processes and equitable policy implementation. The creation of livable, equitable communities is essential for individuals and groups to achieve economic stability, social well-being, and environmental health. Having an understanding of how livability outcomes can influence the economic and environmental health of an area is crucial for sustainable development and a sustainable society. These metrics are based on metrics used in prominent social equity indices from Australia, the United Nations, Sustainable Seattle, the Partnership for Sustainable Communities, and the President’s Council on Sustainable Development.
Metrics and Data Sources:
| Metric Name | Definition | Data Source |
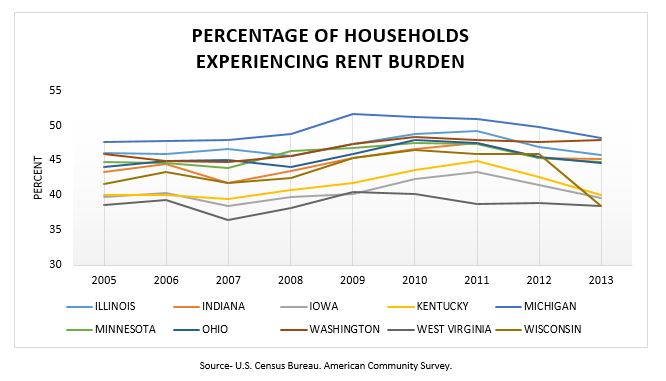
| Rent Burden | The percentage of the population of renters experiencing rent burden, meaning the household spends more than thirty percent of its income on rent | U.S. Census Bureau American Community Survey 1-year estimates (2005-2013) |
| Access to Transportation | The percentage of households lacking a vehicle | U.S. Census Bureau American Community Survey 1-year estimates (2009-2013) |
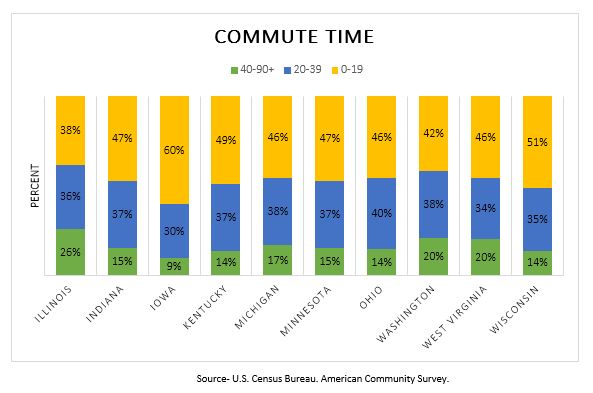
| Commute Time | The percentage of commuters spending 1-19 minutes, 20-39 minutes, and 40-90+ minutes commuting | U.S. Census Bureau American Community Survey 1-year estimates (2009-2013) |
Metric Findings:
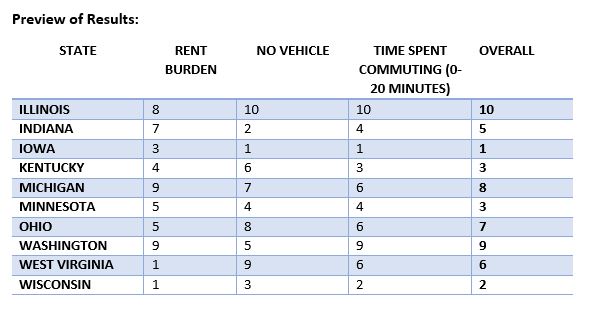
- Most states experienced a peak in rent burden percentages in 2009, shortly after the beginning of the Great Recession. The percentage of rent burdened households is trending downward for all states except Washington and Indiana.
- At seven percent, Indiana is below the national average of 9.2 percent for households with no vehicle.
- Illinois has the longest commute times of the states analyzed, with 38 percent of its workers falling into the 0-19 minute commute time category and 26 percent of its workers falling into the extreme commute time category. The remaining states have little variation in percentages between the three commute time categories.
Policy Considerations:
- A high percentage of households experiencing rent burden may be due to a shortage of affordable housing or may be due to high levels of unemployment or underemployment. Indiana and other states should strive to reduce the number of households experiencing rent burden to increase the amount of disposable income families have and to reduce material hardship and family stress. One option is through zoning requirements that stipulate that a certain number or percentage of new construction units must be affordable.
- States should continue to invest in public transportation because, while car ownership is favorable in terms of economic stability and social equity, high levels of car ownership contribute to greenhouse gas and particulate matter emissions.
![]()