
Community Sub-Indicator
The following metrics attempt to capture information about the cohesiveness, strength, and civic engagement of communities. They provide a general evaluation of the relationships and interactions between individuals, groups, and the public and nonprofit sector. Characteristics of a strong, sustainable community include: optimism, a focus on unification, consensus building, tolerance, sharing of power, and empowerment of citizens. The creation of sustainable communities can foster regional economic growth, a high quality of life, and empathy between disparate social groups. Having an understanding of how community outcomes can influence the economic and environmental health of an area is crucial for sustainable development. The metrics are based on metrics used in prominent community indices from Australia, the United Nations, Sustainable Seattle, the Partnership for Sustainable Communities, and the President’s Council on Sustainable Development.
Metrics and Data Sources:
| Metric Name | Definition | Data Source |
| Access to Broadband Internet | The percentage of households with Broadband Internet availability | National Telecommunications and Information Administration (2003) |
| Nonprofit Organizations | The number of nonprofit organizations per 10,000 persons | National Center for Charitable Statistics (2005-2009) |
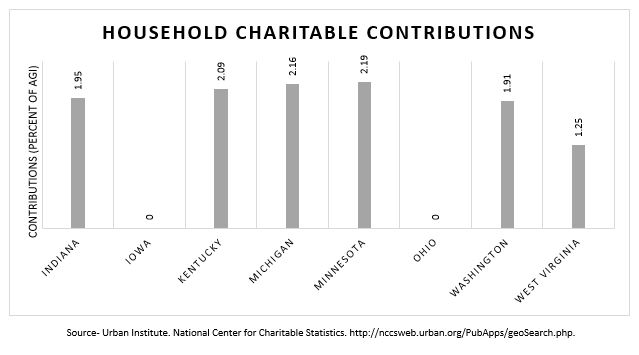
| Charitable Contributions | Contributions as a percent of adjusted gross income (AGI) | National Center for Charitable Statistics (2005-2009) |
| Volunteerism | The percentage of the population that engaged in volunteer activities during the year | Corporation for National and Community Service (2004-2006) |
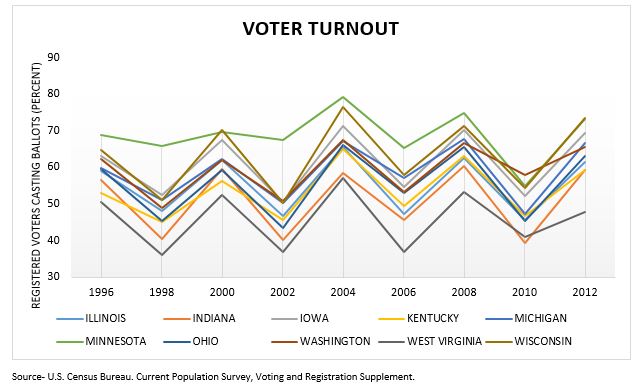
| Political Participation | Voter turnout for Congressional and Presidential elections as a percentage of registered voters | U.S. Census Bureau “Current Population Survey Voting and Participation Supplement” (1996-2012) |
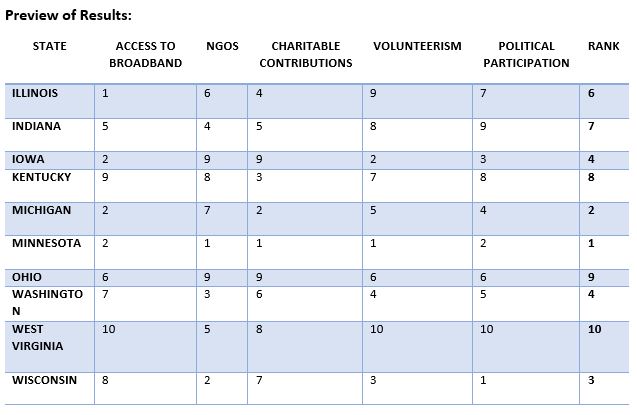
Metric Findings:
- All states have between 95 percent and 100 percent access to Broadband Internet.
- Ranking in the middle of the states, Indiana’s charitable contributions are 1.95 percent of Indiana residents’ area gross income.
- Minnesota consistently has had the higher rate of voter turnout over the years. Minnesota also has less variability in voter turnout between Congressional election and Presidential election years.
- Indiana has a low rate of volunteerism and voter turnout.
- West Virginia scored the worst in three of the five metrics (access to Broadband Internet, Volunteerism, and Voter Turnout).
Policy Considerations:
- The low volunteerism and voter turnout rates are keeping Indiana’s Community index score toward the lower end of the list. These poor scores may indicate that Hoosiers do not feel connected to their community and do not feel like their voice matters in the political process. This disengagement fosters a “status quo” mentality and is not supportive of sustainability and initiatives that would increase social equity.
![]()