
Coal Burning Sub-Indicator
Electric generation from coal produces emissions that have an effect on human health and the environment. These effects vary from cancer, reproductive effects, ecological effects, as well as many others. Eight pollutants were analyzed examining the total amount of emissions in metric tons and also the amount of the emission in pounds per kWh. The latter provides an idea of the efficiency of the plants in the states for the eight emissions. The eight emissions analyzed were the six criteria pollutants, particulate matter, carbon monoxide, ozone, lead, sulfur dioxide, and nitrogen dioxide; mercury, and carbon dioxide. Seven of these eight pollutants are regulated under the Clean Air Act currently, but carbon dioxide may become regulated under Rule 111 (D) under the Clean Air Act with the final rule issued in the summer of 2015.
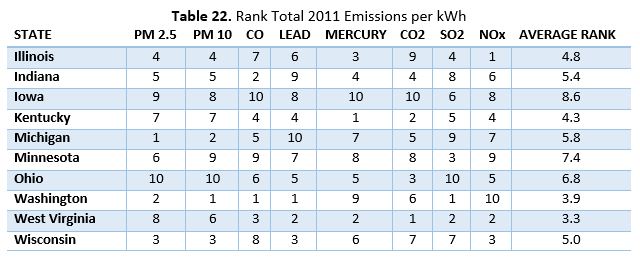
The findings for each of these eight emissions overall demonstrate that all emissions are decreasing over time except for carbon monoxide. The findings also demonstrate that states that use coal as their primary electric generation source, emit large volumes of pollutants. However, when the efficiencies of states are examined in pounds per kWh, some states have higher efficiencies than other states that have less total emissions. When states are ranked by the eight emissions in Table 21 and 22, a clear comparison exists.
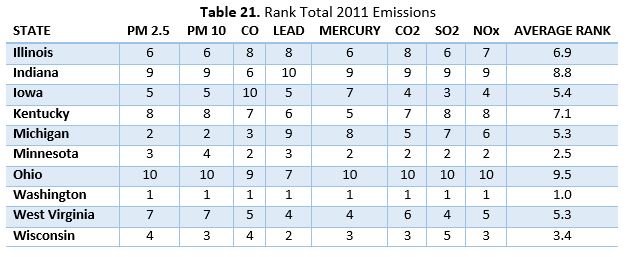
The coal generating states are the dirtiest emitters for total emissions in 2011 as shown in Table 21. Ohio is the worst emitter with an average rank of 9.5 and Washington is the cleanest emitter with an average rank of 1. Indiana falls second to Ohio for total 2011 emissions. However, when examining total 2011 emissions per kWh in Table 22, Iowa has the worst efficiency in terms of emissions per kWh ranked at 8.6 and West Virginia has the best efficiency ranked at 3.3. Indiana is ranked in the middle for emissions efficiency, which many will find surprising. It is also important to note that states that one may consider a clean energy state, like Washington, have more emissions per kWh than some of the heavier emitting states like Ohio or Indiana. As examples, mercury and nitrogen dioxide emissions for Washington are ranked 9 and 10, respectively, whereas Ohio is ranked 5 and 5, respectively.
More policies through the Clean Air Act need to be adopted to decrease the amount of coal used to reduce the total emissions, and policies also need to be adopted to continue to increase efficiencies for states. This will provide a cleaner and healthier environment for all.
![]()