
Coal Disposal Sub-Indicator
Coal combustion residuals, known more generally as “coal ash” are generally considered a primary industrial waste in the United States, with a total nation-wide generation of nearly 115 million tons in year 2013 (ACAA 2014). This waste stream can contain heavy metals like arsenic, cadmium, mercury, and lead, as well as other toxic contaminants at various concentrations, which can harm human health when they leach into water or become airborne (EPA 2015).
Though coal ash can be reused in the production of concrete and other construction materials, the vast majority is disposed of in dry landfills or slurry ponds. Currently, best-practice pollution control technologies like liners and leachate collection systems are not mandatory in the vast majority of states. Furthermore, nearby water monitoring is not consistently required and many states fail to set engineering and design standards (EarthJustice 2011b). The following metrics aim to index the sustainability of coal ash disposal in our ten states of interest:
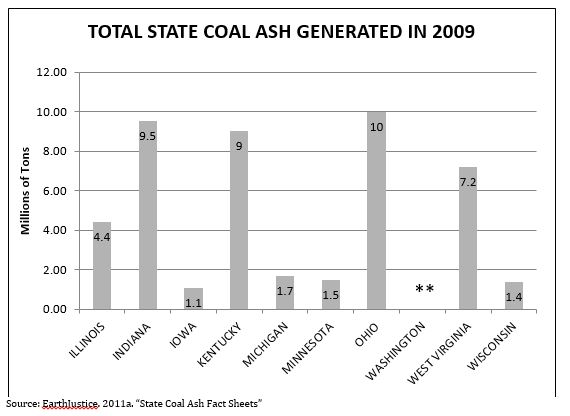
- Total Coal Ash Generation
- Number of Coal Ash Disposal Sites Established Since Year 2000
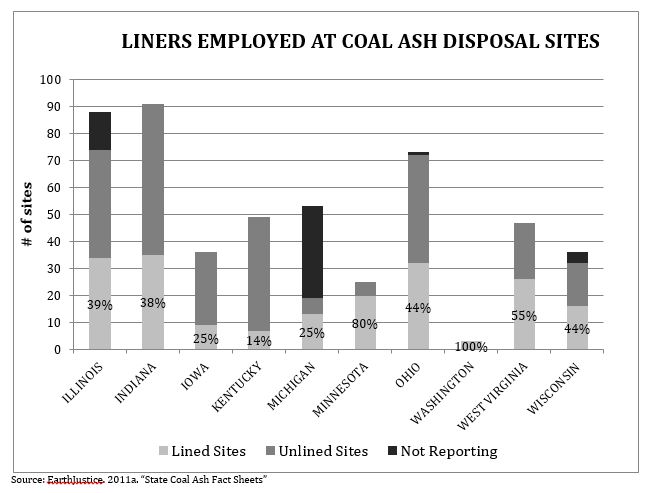
- Percentage of Coal Ash Disposal Sites with Liners
- Percentage of Coal Ash Disposal Sites Collecting Leachate
- Regulation Stringency for Coal Ash Disposal
- Total Reported Heavy Metal Discharges into Water and Soil
Data from the first five metrics originate from the Environmental Protection Agency. However, they were first collected and assembled in various reports by EarthJustice, the non-profit, public interest law organization originally established by the Sierra Club. Since these data are not collected by EPA on a regular basis, the data used for metrics 1-5 in this section only represent the year 2009. Data for the sixth metric were collected from EPA’s Toxics Release Inventory.
A sampling of results are highlighted here:
| HEAVY METAL DISCHARGE RANKINGS | ||||||
| Mercury Surface | Lead Surface | Mercury Land | Lead Land | Average | Metric Rank | |
| ILLINOIS | 7 | 9 | 9 | 6 | 7.75 | 9 |
| INDIANA | 8 | 6 | 6 | 9 | 7.25 | 7 |
| IOWA | 5 | 8 | 2 | 3 | 4.5 | 4 |
| KENTUCKY | 10 | 10 | 7 | 10 | 9.25 | 10 |
| MICHIGAN | 9 | 5 | 5 | 5 | 6 | 5 |
| MINNESOTA | 2 | 4 | 4 | 4 | 3.5 | 3 |
| OHIO | 6 | 7 | 8 | 8 | 7.25 | 7 |
| WASHINGTON | 1 | 1 | 1 | 1 | 1 | 1 |
| WEST VIRGINIA | 4 | 3 | 10 | 7 | 6 | 5 |
| WISCONSIN | 3 | 1 | 3 | 1 | 2 | 2 |
In conclusion, we have estimated overall performance our ten states for our selected coal-ash-related metrics by averaging the rankings for each metric, then re-ranking based on this “average score.” By this measure, we conclude that the state of Washington is performing most sustainably in terms of their coal ash disposal and technological safeguards employed to protect land and water quality, and thereby human health and property values. The state of Indiana falls in last place for the overall sustainability of coal ash disposal. See tables below:
| SUMMARY OF STATE RANKINGS FOR COAL ASH DISPOSAL METRICS | |||||||
| State | Total Ash |
Est. Since 2000 |
Liners | Collecting Leachate |
Regu-lations | Heavy Metals |
Average Score |
| Illinois | 6 | 8 | 6 | 9 | 2 | 9 | 6.67 |
| Indiana | 9 | 10 | 7 | 8 | 6 | 7 | 7.83 |
| Iowa | 2 | 5 | 8 | 7 | 5 | 4 | 5.17 |
| Kentucky | 8 | 4 | 10 | 5 | 6 | 10 | 7.17 |
| Michigan | 5 | 2 | 9 | 10 | 3 | 5 | 5.67 |
| Minnesota | 4 | 5 | 2 | 4 | 6 | 3 | 4.00 |
| Ohio | 10 | 9 | 5 | 3 | 6 | 7 | 6.67 |
| Washington | 1 | 2 | 1 | 2 | 6 | 1 | 2.17 |
| West Virginia | 7 | 7 | 3 | 1 | 1 | 5 | 4.00 |
| Wisconsin | 3 | 1 | 4 | 6 | 3 | 2 | 3.17 |
| State | Overall Rank |
| Illinois | 7 |
| Indiana | 10 |
| Iowa | 5 |
| Kentucky | 9 |
| Michigan | 6 |
| Minnesota | 3 |
| Ohio | 7 |
| Washington | 1 |
| West Virginia | 3 |
| Wisconsin | 2 |
Sources:
American Coal Ash Association. “2013 Coal Combustion Product Production & Use Survey Report.” ACAA Reports (2014): 2014. Web. 29 Apr. 2015. Accessible HERE.
EarthJustice. “How Safe Is Your State?” Earthjustice.org (a), 18 Feb. 2011. Web. 19 Mar. 2015. Accessible HERE.
EarthJustice. “State of Failure: How States Fail to Protect Our Health and Drinking Water from Toxic Coal Ash.” EarthJustice.org (b), 1 Aug. 2011. Web. 19 Mar. 2015. Accessible HERE.
Environmental Protection Agency. “Coal Ash Basics”. EPA.gov, 10 Feb. 2012. Web. 28 Mar. 2015. Accessible HERE.
Environmental Protection Agency. “Release Reports – TRI Metadata.” EPA.gov, Web. 1 Apr. 2015. Accessible HERE.
![]()