
CAFO Agriculture Water Metric
 CAFOs or Concentrated Animal Feeding Operations are a practice in agriculture where large amounts of livestock – including everything from chickens to cows- are contained within a relatively small area. This large concentration of animals near water sources makes the possibility of contamination from the animals, their waste, or their food likely. This contamination can include excess nitrogen, phosphorus, microbial infection, or waste particulates; all of which can damage water quality and upset the balance of the ecosystem.
This metric looks at 23 individual categories ranging from environmental, financial and policy all of which provide a look at how effectively CAFOs are regulated within each of the states examined. Some of the metrics examined include NDPES compliance, physical requirements, funding, personnel, and animal pollution. Based on grades obtained from scoring these metrics, it is assumed that states with a higher percentage overall or fairly moderate scores per category have a decent policy in place for the regulation of CAFOs. If there is an adequate amount of enforcement and oversight, it is assumed the states’ CAFOs are less likely to contaminate and damage surrounding water sources.
Data for this metric was largely obtained from the Environmental Protection Agency, as well as several state agencies, and some academic resources. All of the categories were given a score out of 10. Scores from 1-10 were given for numerical data and scores of 0,5, or 10 were given for categorical data with about 9 categories scored using numerical data and 14 scored using categorical data. Based on this type of scoring, states are given an equal opportunity to obtain the same score in categorical data and are scored relatively using numerical data allowing for all states to score within what is considered the A-B range, and still allowing for states to have separate scores so ranks can be distinguished. Given this type of scoring, it is the hope that when all states are added to the metric and the relative rankings changed the overall grade of the state will not fluctuate too much because there will be enough data to normalize the score.
Preview of Results
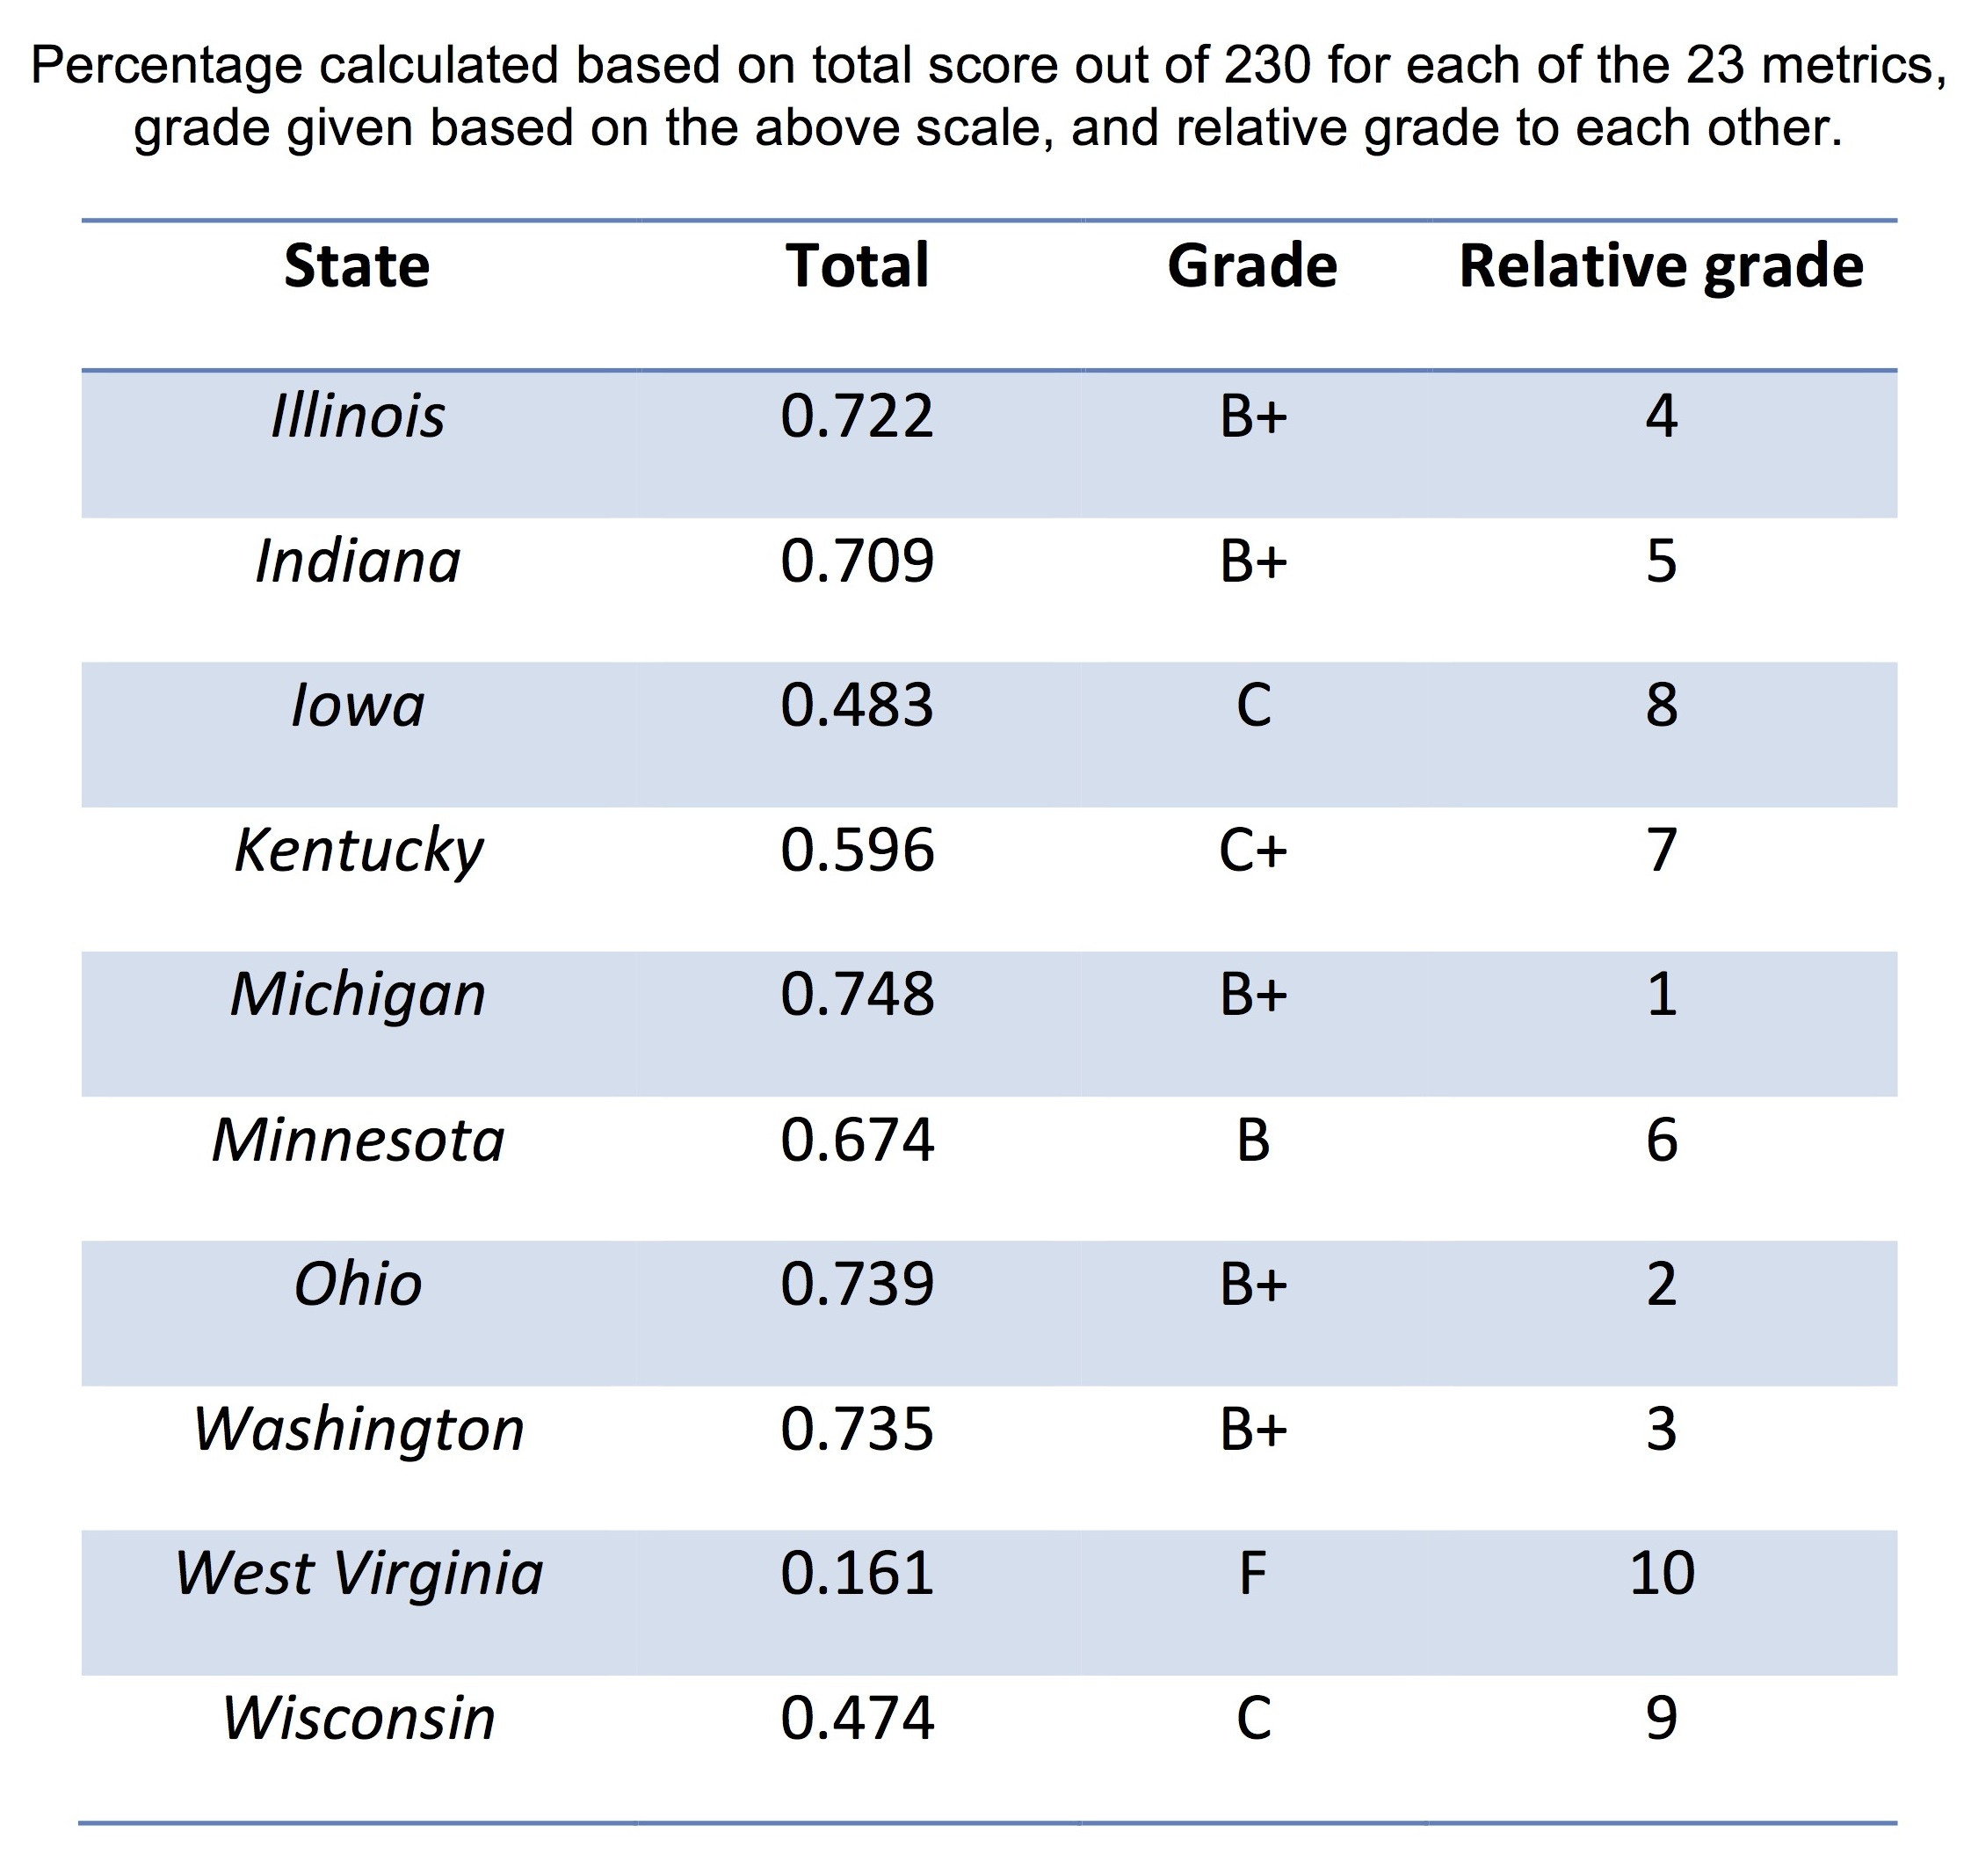
Metric Findings
-
Assumptions:
- The more metrics were used, the more normalized the score would be, so the addition of the other 40 states would not cause a huge change in each states’ percentage
- Therefore, the current grade is assumed to be an accurate representation of the current status of CAFOs within each state according to the data available
- All 23 metrics were of equal importance to the impact CAFOs have on water quality, so no metrics were weighted
- It was assumed no data meant no funding, personnel, compliance, etc. was enforced when in fact the opposite could be true and the state does not feel it is important to report
- The more metrics were used, the more normalized the score would be, so the addition of the other 40 states would not cause a huge change in each states’ percentage
-
Findings:
- Many of the states examined are not compliant with NPDES regulation
- Most states examined enforce some physical requirement upon CAFOs to limit contact with water sources and require monitoring to determine how much contamination does enter the water
- Many states do not inspect CAFO sites frequently enough or notify when violations are found
- Except West Virginia, which had no data available, all states notify CAFOs when they are noncompliant with current regulations
- Based on the data provided, states with greater number of CAFOs such as Iowa, Indiana, and Minnesota actually have the fewest number of inspectors per CAFO based on available data
- Indiana was the only state to require a study of the effects CAFOs have upon their environment
- Even though CAFOs are defined as 1000 animal units per area site, different states have different numbers of animal units per acre of farmland
-
Policy Considerations:
- More states need to enforce obtaining a NPDES permit
- The frequency of inspections should increase from biannually and annually to biennially in order to increase the chances of noticing a violation
- More state inspectors should be available in states with a larger number of CAFOs so that inspectors take their time and do not feel hurried to adequately inspect the CAFOs they are assigned.
- All states, except Indiana which currently has a study, should create to study to examine the effects CAFOs have upon their environment
- A more stringent definition than 1000 animals per area should be enacted at the federal level so CAFOs across states can be compared
For more information on State Sustainability Index’s CAFO Metric, click here to find the complete SustainIN Capstone Report
![]()