
Agricultural Land Use Index
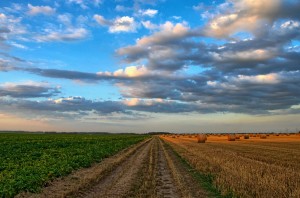 The way land is used and managed in agriculture can have a significant impact on water quality. Some of basic land use practices used in agriculture that impact water quality include drainage, fertilization, tillage, cover crop, agroforestry, grazing, and conservation. These practices can all play roles in soil quality, nutrient cycling, run-off, erosion, and the productivity of farmland. The negative water quality impacts associated with these practices include non-point source water pollution, nutrient loading, potential increased costs associated with treating water to meet drinking and quality standards, and habitat and biodiversity reduction.
In this metric, 10 different categories of land use practices were examined and combined to create an overall score for each state. Data from the 2012 USDA Census and 2014 USDA Conservation Reserve Program were used to build the metric. For the majority of categories, percentages of total farms and acres in each state were calculated that employ each of the land use practices. Most practices were scored out of a 20 point scale while others were scored on a 10 point scale based on their limited impacts on water quality, or limited employment generally. One cater gory, Conventional Tillage, was scored in reverse for its perceived negative impact on water quality. Percentage scores were calculated out of the total 160 possible points and then a letter grade was assigned using a quintile grading scale.
Land use categories included, the number and percent of farms and land (160 total points):
- Drained by Tile – 10 points
- Artificially Drained by Ditches – 10 points
- Under Conservation Easement – 20 points
- With No Till Practices Used (Cropland) – 20 points
- With Conservation Tillage Used (Cropland) – 20 points
- With Conventional Tillage Used (Cropland) – 20 points, scoring reversed
- Planted to Cover Crop (Cropland) – Excluding USDA’ CRP – 20 points
- Rotational and Managed Intensive Grazing – 10 points
- With Alley-Cropping and Silvapasture – 10 points
- Enrolled in the USDA’S CRP – 20 points
Preview of Results
Metric Findings
-
Assumptions:
- It was assumed that all but one of the 10 land use practice categories had some water quality benefit when compared to the conventional farming alternative.
- It was also assumed that conventional tillage had a negative impact on water quality and that the two categories relating to drainage only had incremental benefits for water quality when compared to traditional surface drainage.
- Percentages of farms and acres utilizing each practice compared to all farms and acres in each individual state allowed for normalization of the data to compare across states.
- Letter grades were assigned using a quintile scale.
-
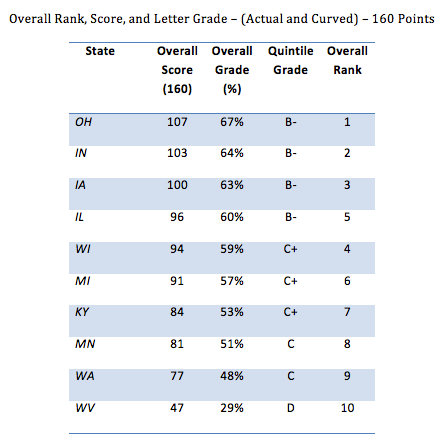
Findings:
- None of the 10 index states received higher than a 67% overall score
- The range of scores was 29%-67%
- Indiana finished 2nd overall with a 64% score.
-
Policy Considerations:
- This metric did not provide an overview or analysis of policy or regulations relating to agricultural land use. Further expansion of this metric could investigate adding a policy component.
For more information on State Sustainability Index’s Agricultural Land Use and Water Quality Metric, click here to find the complete SustainIN Capstone Report
![]()