
Non-Point Source Pollution Metric
In the Clean Water Act, the EPA defines point source pollution as follows:
(14) The term “point source” means any discernible, confined and discrete conveyance, including but not limited to any pipe, ditch, channel, tunnel, conduit, well, discrete fissure, container, rolling stock, concentrated animal feeding operation, or vessel or other floating craft, from which pollutants are or may be discharged. This term does not include agricultural stormwater discharges and return flows from irrigated agriculture. [502(14) amended by PL 100-4]
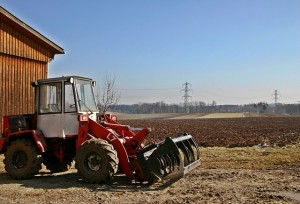 Conversely, non-point source pollution is more loosely defined as pollution that does not fall under this definition. Generally, non-point source pollution can be thought of as diffuse pollution that is transported by rain or snow runoff to bodies of water. Most agricultural pollution qualifies as non-point source pollution and plays a major role in the impairment of waterbodies in the United States. This pollution usually occurs in the form of nutrients, pesticides, or animal waste.
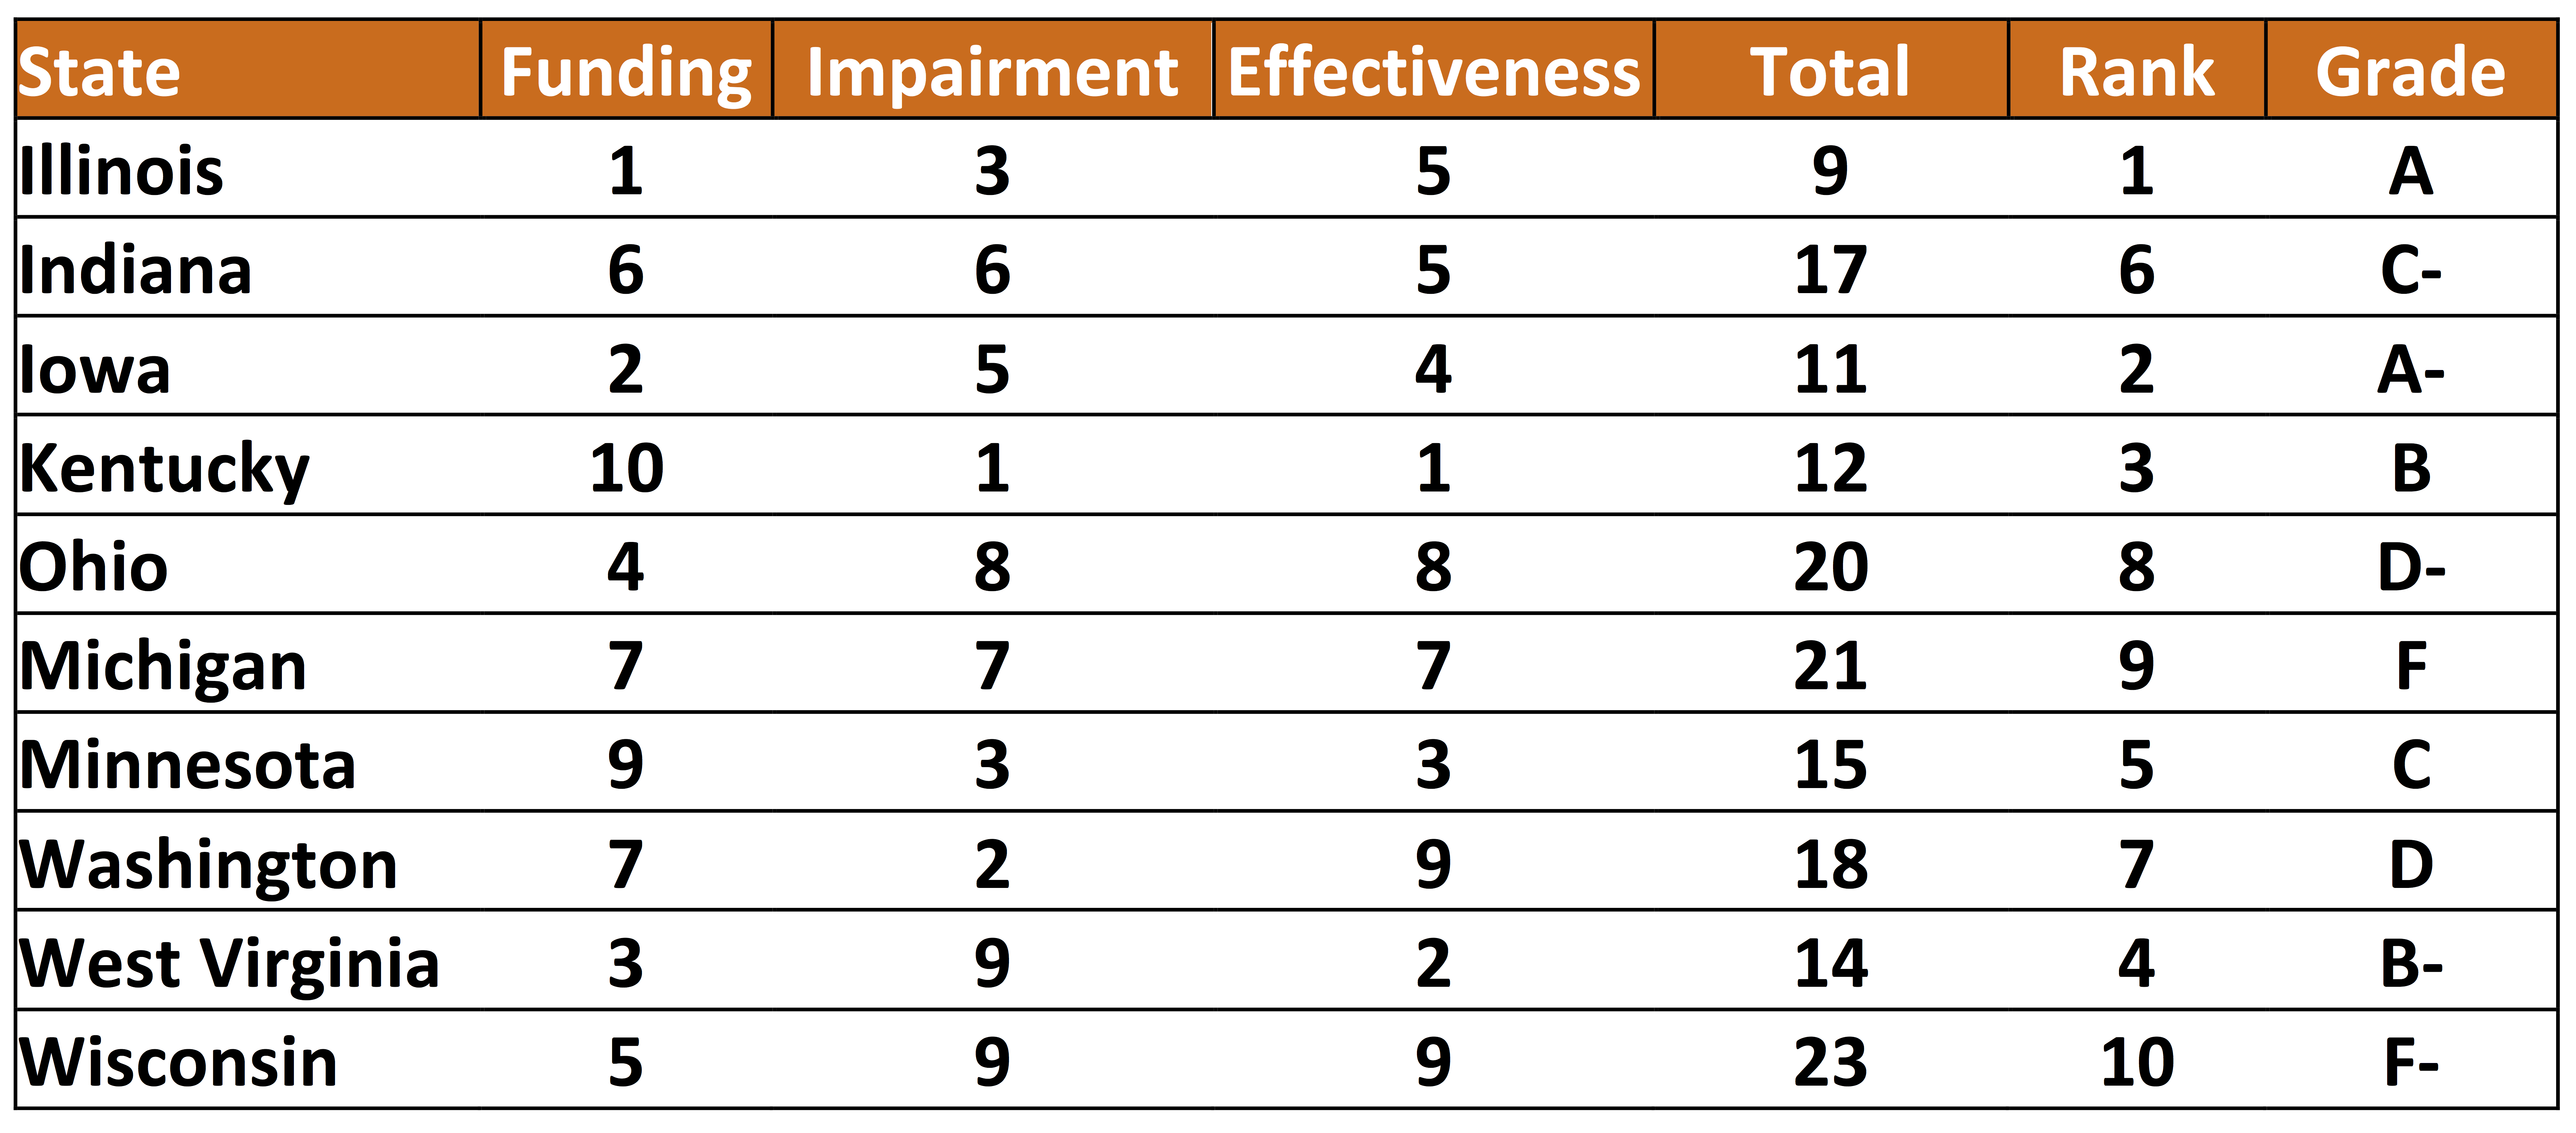
In building this metric, we investigated three factors:
- Funding
- Impairment
- Effectiveness
For funding, we consider many factors of states’ acquisition of federal grants to mitigate non-point source pollution. A few of these include average funding per year, percent of grants related to agriculture, dollars per grant, and trends in funding over time. All factors were given equal weight and a ranking was produced.
Every state is required to report biannually to the EPA on the condition of its waters. Using this information, known as 305 or Integrated reports, we used trends over time in impaired waters as well as investigating how many of these impaired water bodies are due to agriculture. All factors were again given equal weight and a ranking was produced.
To gauge effectiveness, we created an interaction term between average funding per year and the change in time of total impaired water bodies. This gives an indication of how well states are using their money. This interaction term is the basis for effectiveness ranking.
All three factors are given equal weight in the final ranking. The rankings were summed and ranked again to provide the final score.
Preview of Results
Metric Findings
-
Assumptions:
- All data is accurate as reported to the EPA
- All states use similar monitoring practices (this is not true, but necessary to make a comparison)
- Missing data for impaired waterways results in the lowest ranking for that metric
- All rankings are on a relative scale; that is, we are not saying that the highest rankings indicate an ideal pollution level, but just that they are the best among the ten states
-
Findings:
- Funding overall is decreasing
- Number of grants is decreasing
- In some states, the funding per grant is increasing
- Non-point source pollution is increasing in all ten states, though at different rates
-
Policy Considerations:
- Point source pollution is heavily regulated, perhaps policy makers should consider similar regulations for non-point source pollution
For more information on State Sustainability Index’s Non-point Source Pollution Metrics, click here to find the complete SustainIN Capstone Report
![]()