
Water Withdrawal Sensitivity Analysis Metric
 The term water withdrawal refers to the removal of water from any water source. In the context of agriculture, water withdrawals are in the form of freshwater. Freshwater withdrawals are the primary source of withdrawals in the United States and come from surface water and groundwater supplies. Surface water refers to any water source that is readily available on the surface of the earth. This includes lakes, streams, rivers, ponds, wetlands, and any other locations where water is naturally available. Groundwater is water that is found underground in cracks, crevices, and large aquifers. In the agricultural context, groundwater is primarily withdrawn from aquifers via wells.
The chief focus of the water withdrawal metric is to primarily analyze the financial impact that access to water for irrigation practices has on a state by state basis. This sensitivity is based on a dollar per gallon ratio where we evaluate the amount of agricultural revenue that is derived from the usage of one gallon of water. This information is derived from the amount of water used in agricultural operations compared to the economic value of agriculture in each state. This method is used to provide a metric that allows individuals the opportunity to understand how reliant their state is on the water that is withdrawn from their sources. This information can then be used to determine the sensitivity of the state to water issues and provides an economic value to a state’s level of water quality and quantity control mechanisms. The sensitivity analysis assesses the loss of value as a result of poor water quality and loss of water quantity. Many of the state’s economies within our initial index rely heavily on the agricultural sector.
Data for this metric was primarily collected via the Agricultural Census through the United States Geological Survey. This data provided economic and use data that comprise the metric. Ideally, state data would have made up the majority of the data. Unfortunately, inconsistencies in reporting made this unreasonable.
Preview of Results
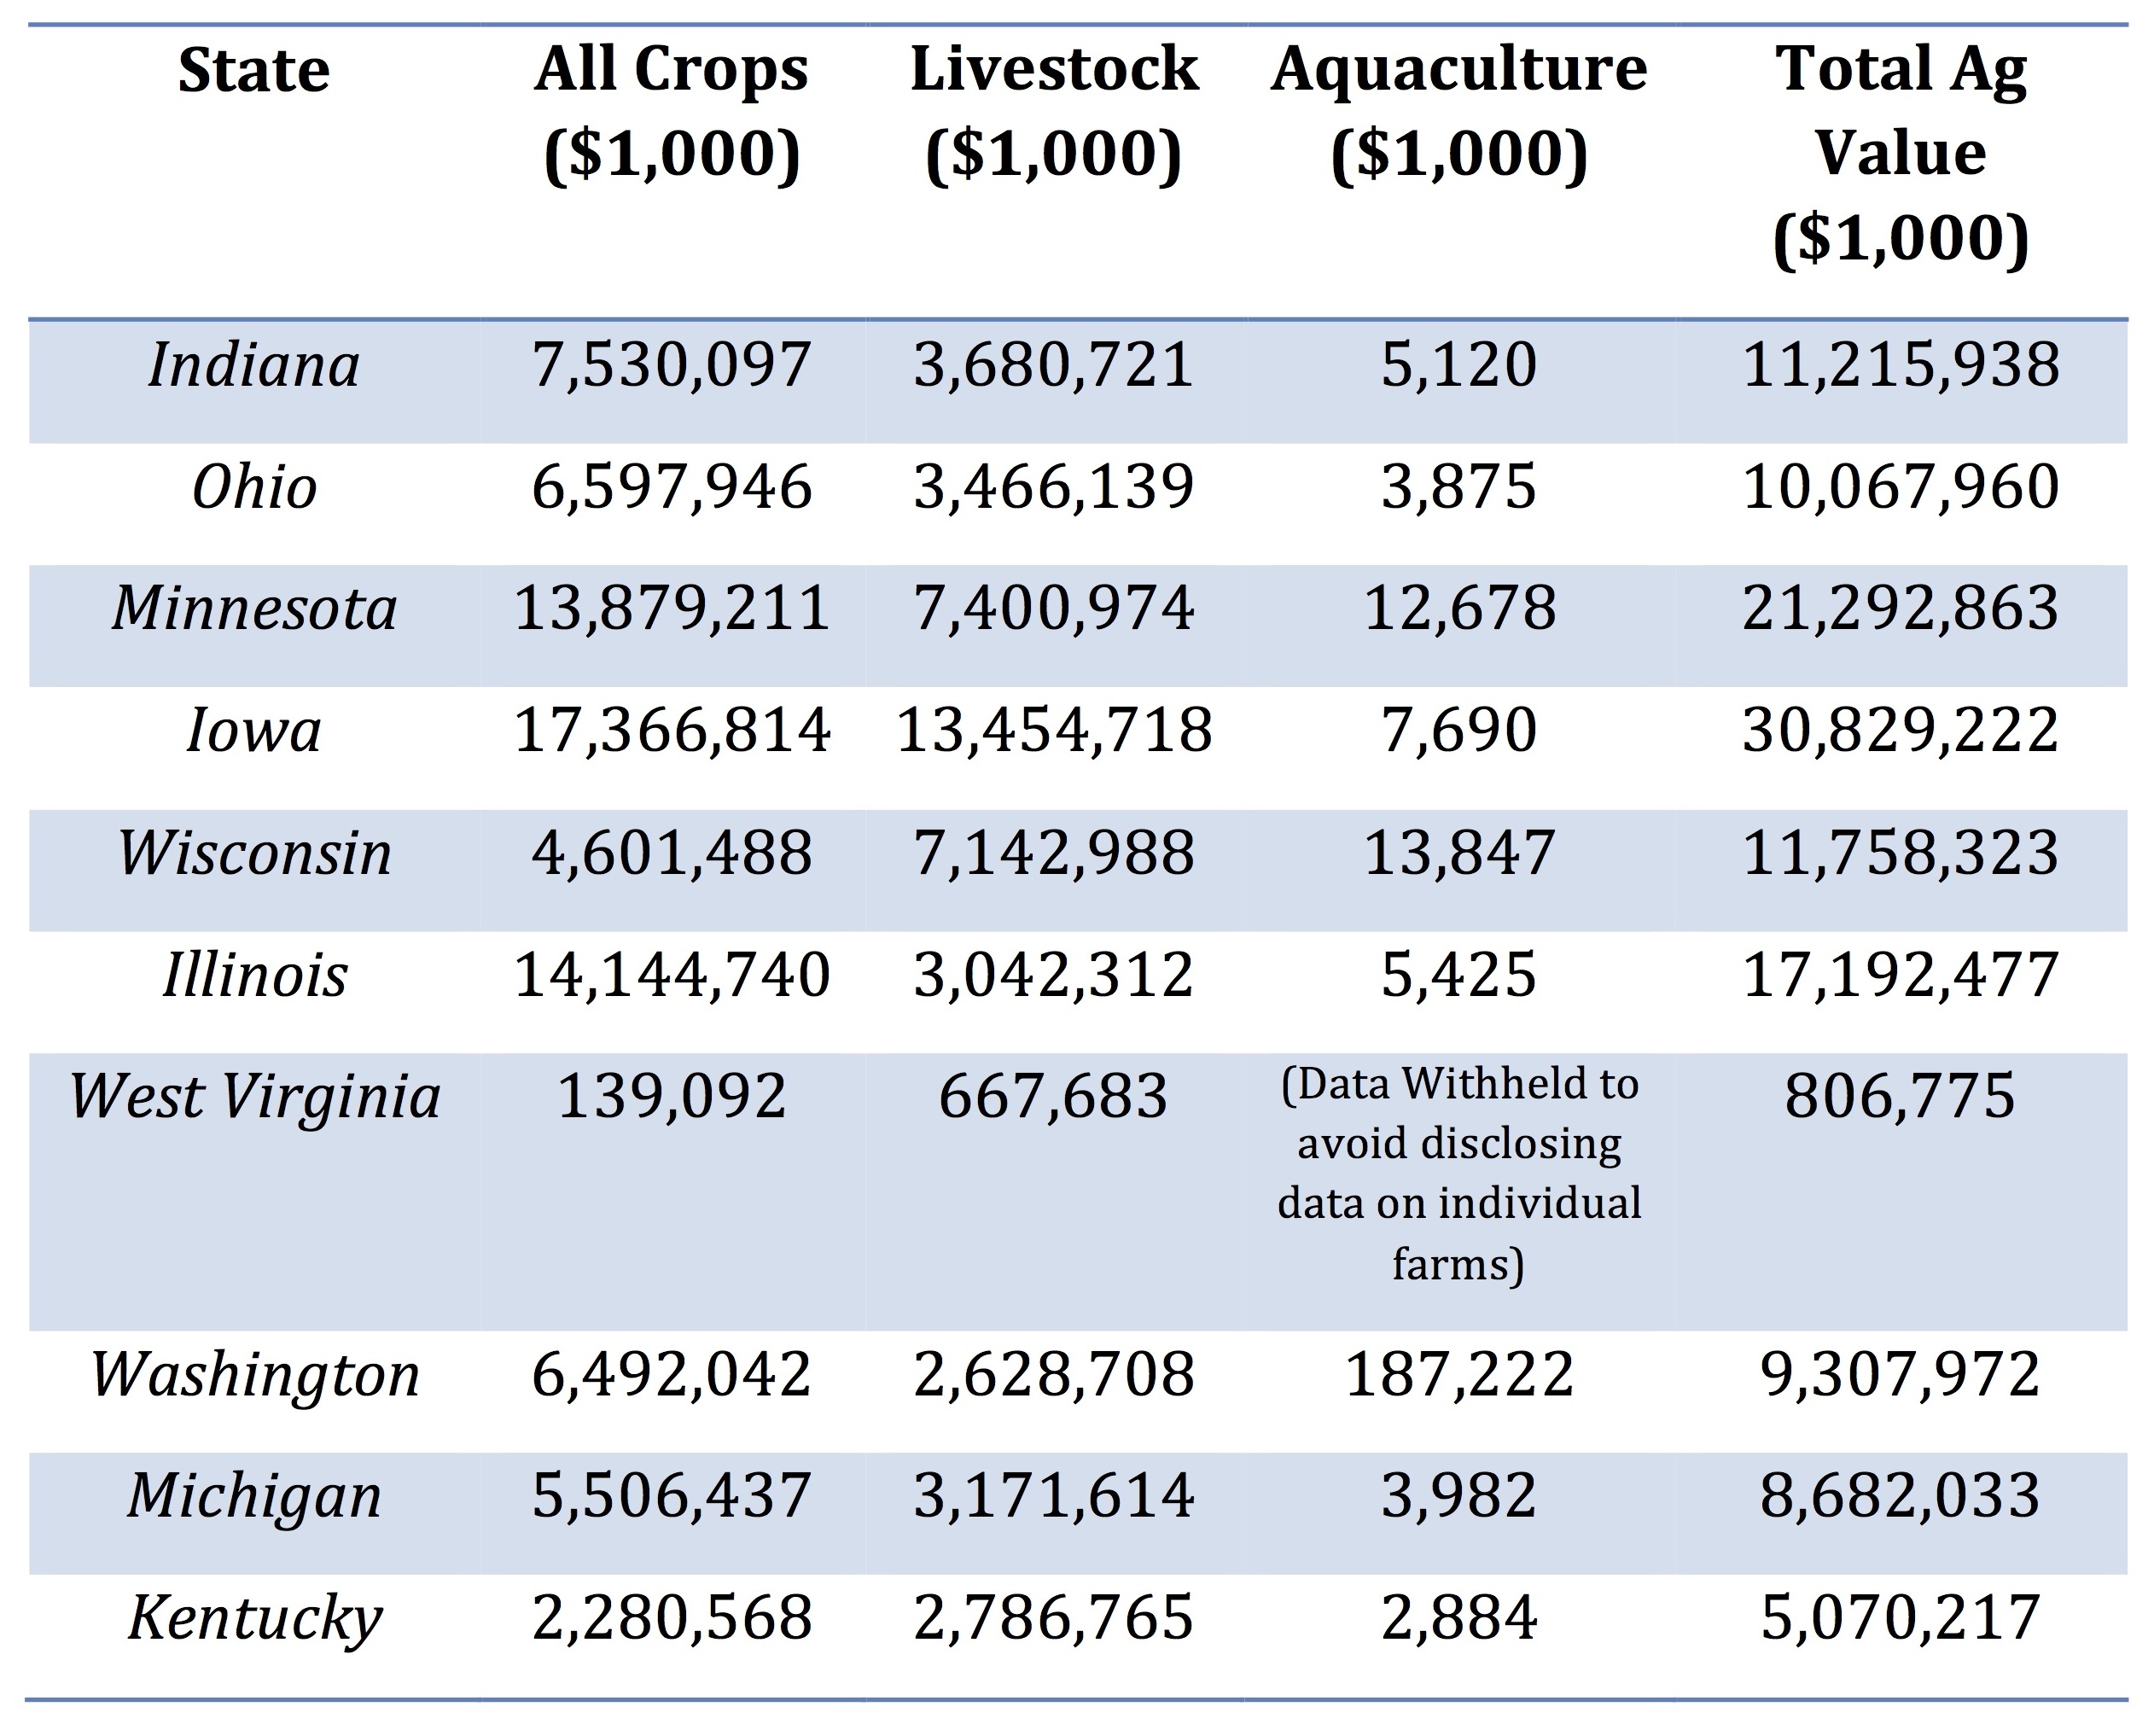
Above: Agricultural Value (2012) for 10 Study States (More Information)
Metric Findings
-
Assumptions:
- Due to the small amount of agricultural operations in the state of West Virginia, the USGS does not provide economic data on individual farms in the interest of competitive balance
- The assumption is that the aggregate data is equal in integrity to the individual data collected in the other states
- Due to the small amount of agricultural operations in the state of West Virginia, the USGS does not provide economic data on individual farms in the interest of competitive balance
-
Findings:
- The economic sensitivity of states varies widely across the states examined
- The states of Iowa and Ohio are relatively low in their sensitivity to water quality and quantity, whereas Washington is extremely reliant on irrigation in order to maintain their operations
- All of the states have some economic interest in maintaining their water bodies
-
Policy Considerations:
- The data presented in this section should not be viewed as a complete sensitivity rating for the states
- Due to limited data in the growing field of aquaculture, the data presented does not represent the entire situation
- However, the data does represent a large portion of the water quantity issues due to the agriculture sector in the ten states and should be viewed as a tool for supporting legislative action
For more information on State Sustainability Index’s Water Withdrawal Sensitivity Analysis Metric, click here to find the complete SustainIN Capstone Report
![]()