
Agriculture-Water Index Fall 2014 Overall Index Results
Below are the results for the pilot states for the Agriculture and Water metrics that we developed. We also provided, but did not provide a ranking for, a water withdrawal sensitivity analysis for the 10 index states. This analysis reviewed the economic impact per gallon of water used in agriculture within each index state.
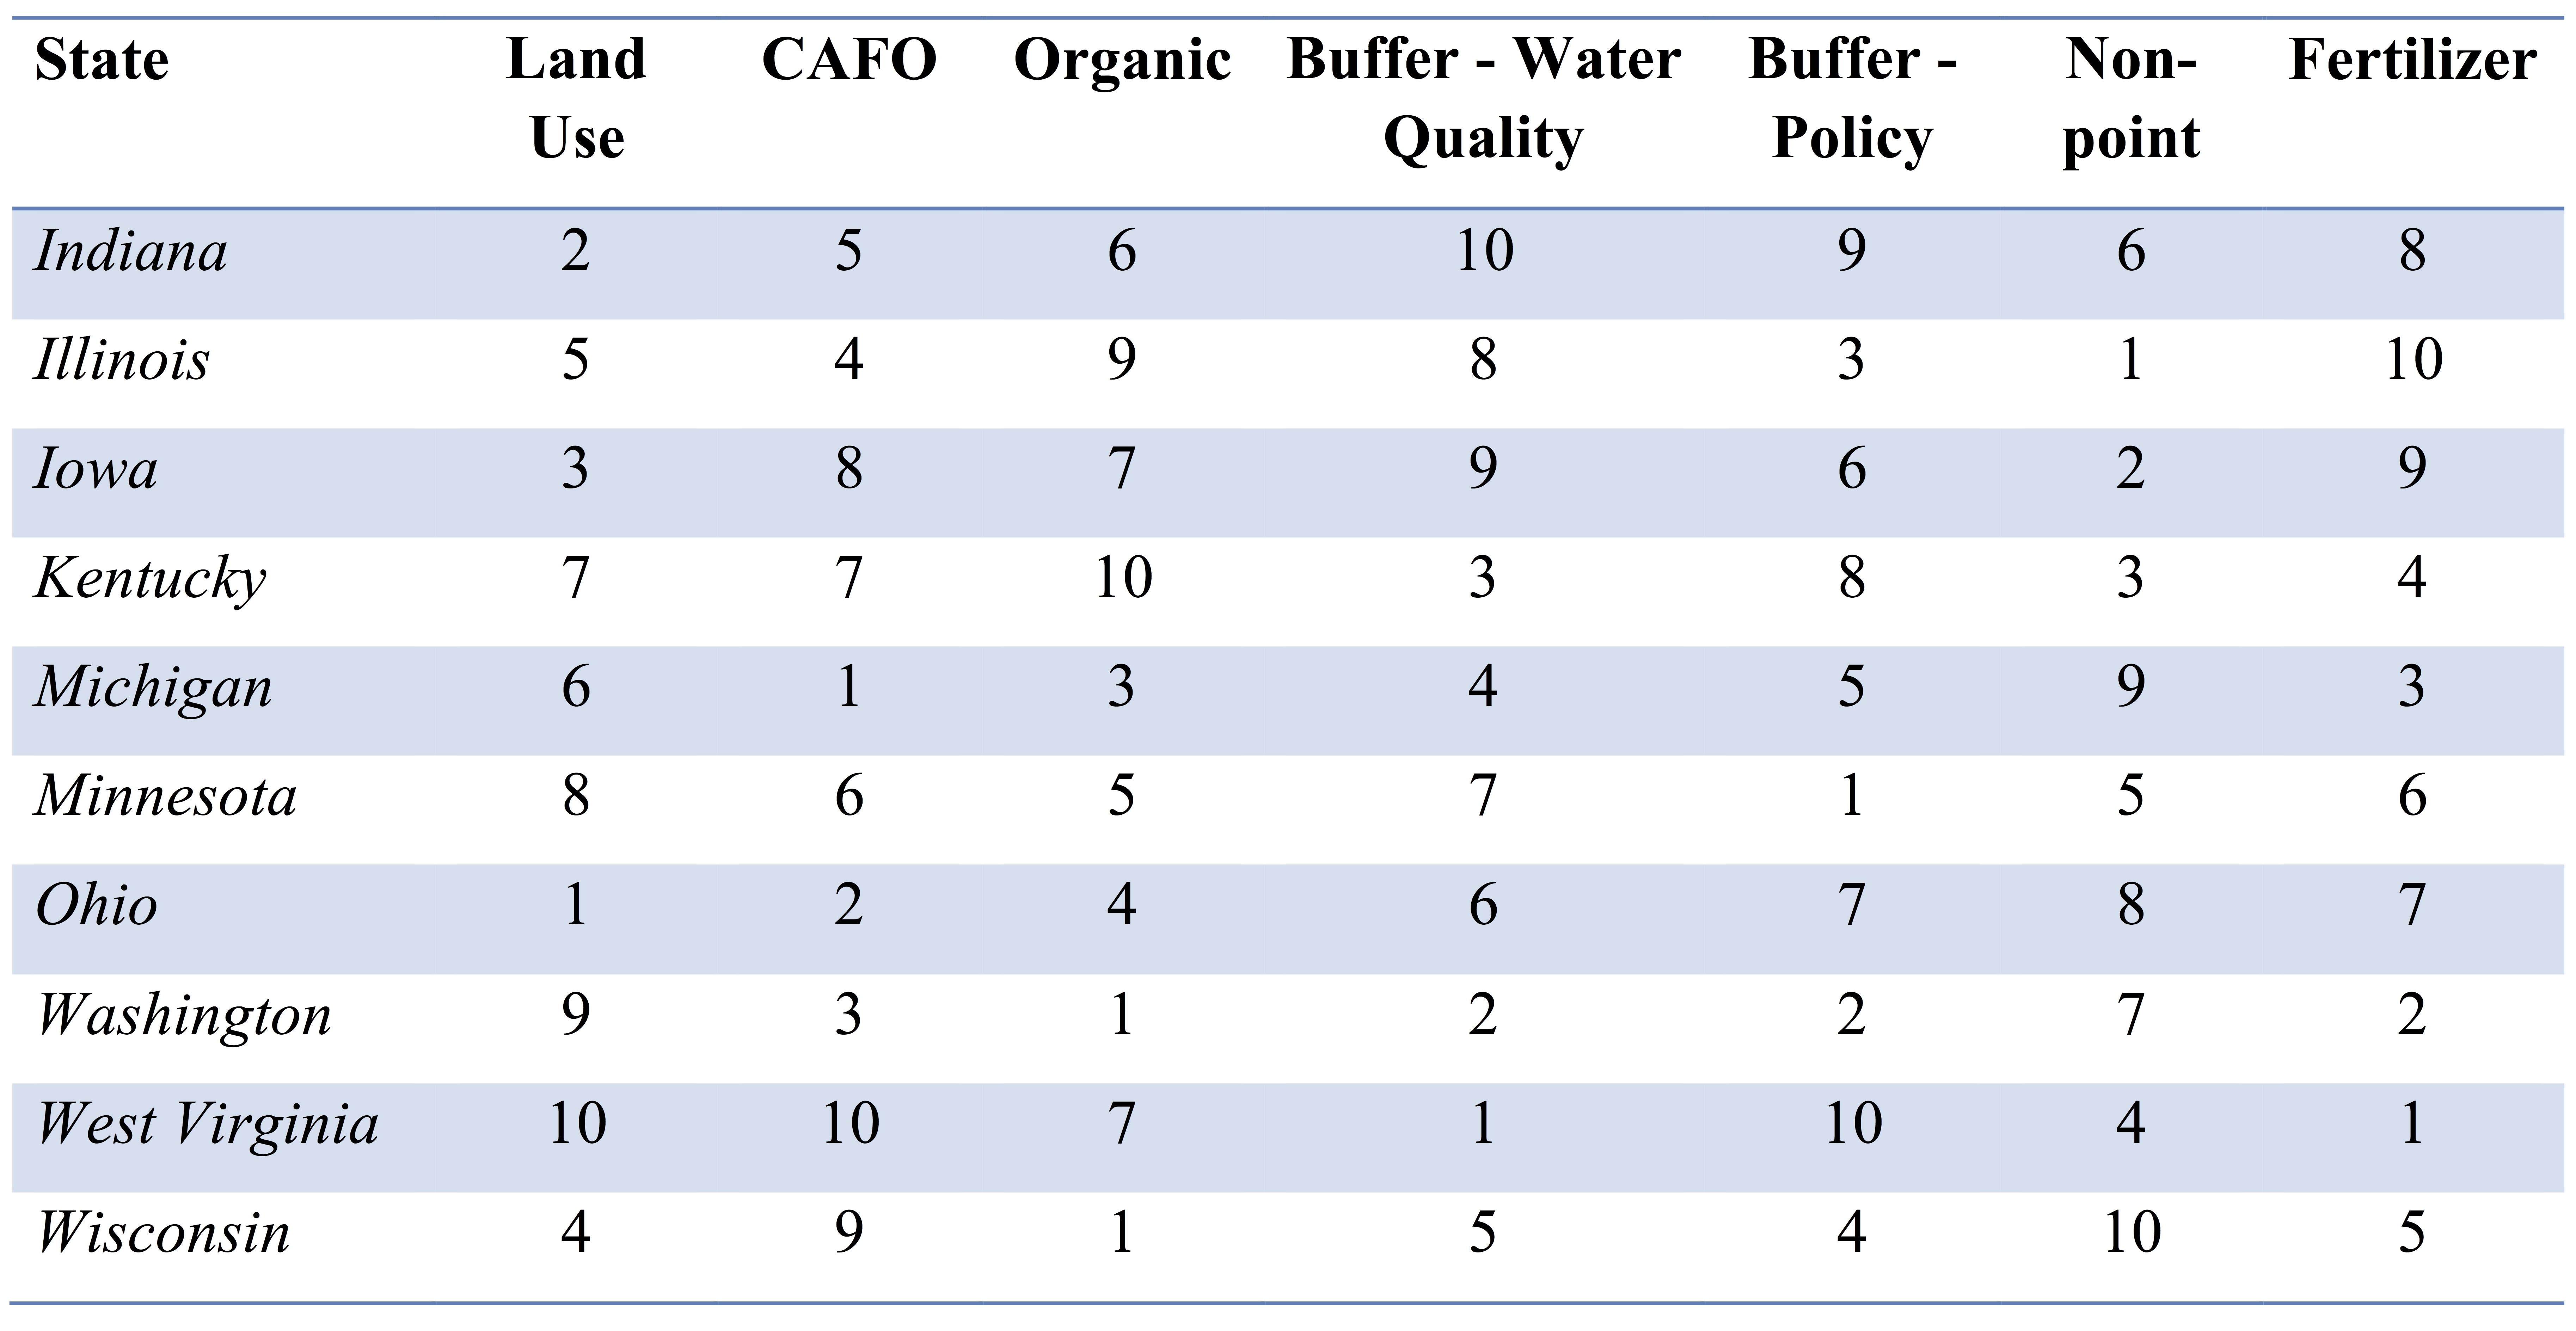
Washington finished 1st overall with an average ranking of 3.7. Indiana finished 10th overall with an average ranking of 6.6. While we realize that the individual metrics are not equal to their impacts to water quality, and that many of these metrics overlap heavily, the overall results do provide a general indication of where a state stands when it comes to water quality within the agricultural sector and these results should provide motivation to improve upon operations and policies related to these issues.
For more information on State Sustainability Index’s Agriculture-Water Metrics, click here to find the complete SustainIN Capstone Report
![]()