
Buffer Water Ag Metric
- Acres of agricultural land within buffer zones of lake, river, and stream shoreline
- Percent of agricultural land within buffer zones
- Comparison of buffer values to other states
- Opportunities for improvement
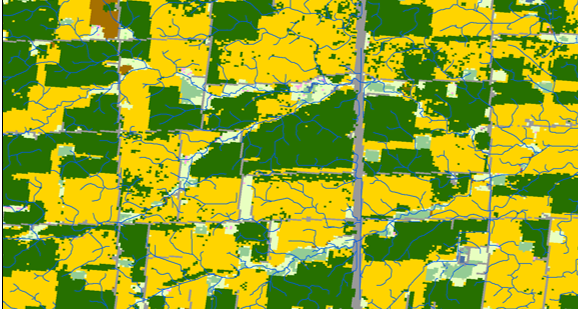
- Corn, which is represented by yellow pixels
- Soybeans, which are represented by dark green pixels
- Forested land, which is represented by light green pixels
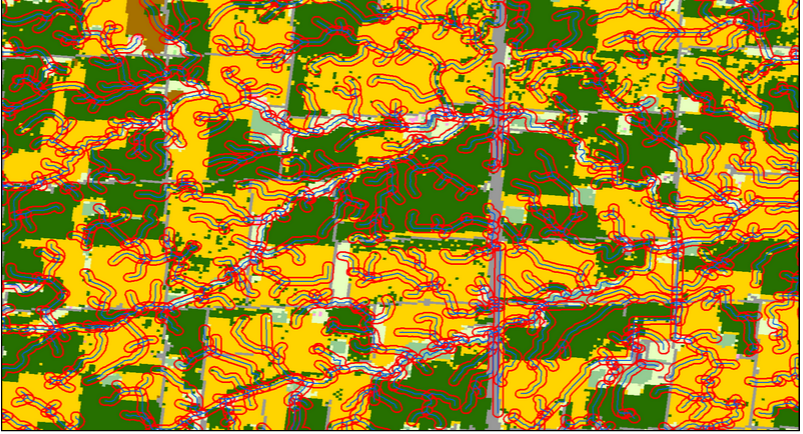
The map below shoes the same region as the previous map with 50 meter buffers represented by the red lines:
The map below shows the types of land use that are within the 50 meter buffers shown in the previous map. The primary land use types located within the buffer are:
- Corn, which is represented by yellow pixels
- Soybeans, which are represented by dark green pixels
- Forested land, which is represented by light green pixels
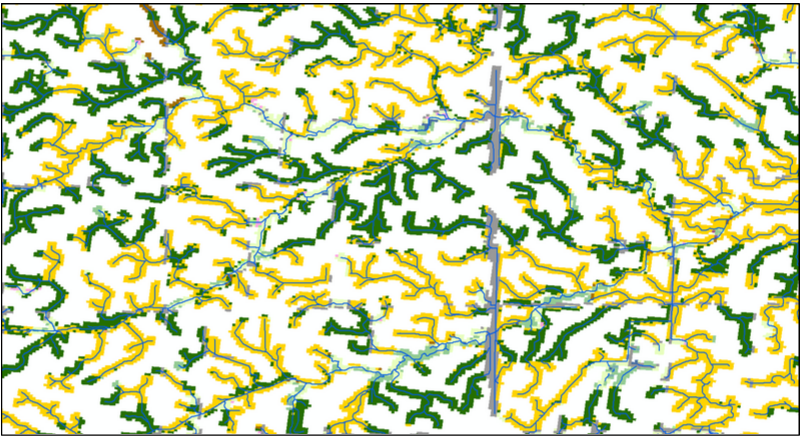
As discussed previously, buffers should be comprised of non-agricultural land, such as forested land, which is represented in this region. However, the majority of the land use type within the 50 meter buffer in this region is either corn or soybeans. This means that the streams in the region will be, holding all other factors constant, more susceptible to agricultural fertilizer runoff pollution than streams that do not have cropland within 50 meters, but instead have buffers that are comprised of either forested land or grassland.
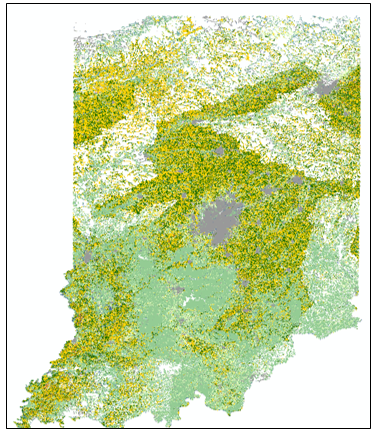
The map below is similar to the previous map and shows the types of land use that are within the 50 meter buffers for all streams in the state of Indiana. The primary land use types located within the buffer are:
- Corn, which is represented by yellow pixels
- Soybeans, which are represented by dark green pixels
- Forested land, which is represented by light green pixels
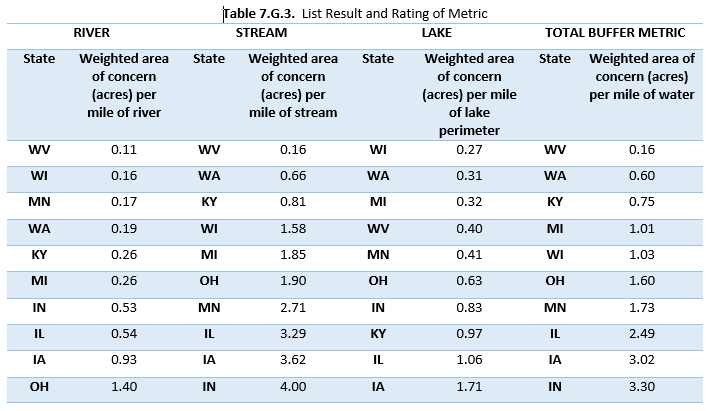
Results
The table below displays the results of the buffer analysis described in the previous section. The weighted area of concern, which is the acres of cropland, per mile of river, stream, lake, and all water bodies can be seen in the table. The area of cropland within buffer zones was weighted by 0.75 for 0-10 meter buffers, 0.20 for 10-25 meter buffers, and 0.05 for 25-50 meter buffers, as described in the methodology section of the final report. For example, a lower weighted area of concern (in acres of cropland) per mile of river indicates that a state has less cropland that is adjacent to rivers than a state with a higher weighted area of concern per mile of river.
Policy Considerations
The table below displays the same results that are displayed in the previous table, but the weighted area of concern (in acres of cropland) is now normalized by the amount of cropland within the state. Therefore, the metric displays the percent of total (weighted) cropland within the buffers of a water body per mile of that type of water body. Due to the fact that the value is in units of percent of total cropland per mile of water body, the value is a small number. However, this does not indicate a small impact on water bodies. This metric can give insights into what kind of policies a state should adopt with regard to buffers. For example, West Virginia does not have a large amount of cropland near its water bodies, which can be seen in the table above, but a larger percentage of the cropland that West Virginia does have is within the buffer distances that were considered for this analysis as compared to the other 9 states that were analyzed.
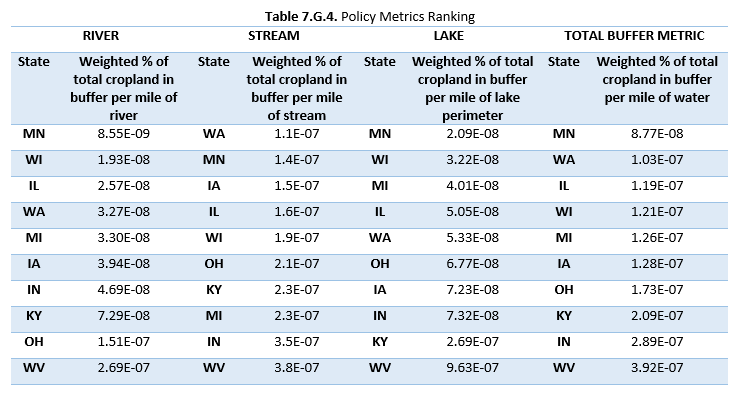 The buffer policy metric ranking above is useful for comparing states while accounting for the difference in the amount of cropland in each state. Additionally, the buffer policy metric ranking is useful for determining which states have buffer-related statutes and regulations that are effective in minimizing the amount of cropland that is near water bodies.
![]()